Tuesday, June 28, 2011

SLJ Macro Partners - And China now inflates the world away

Stephen Jen and his partner Fatih Yilmaz comments on China not being able to supply as much cheap labor as in the previous years therefore exporting inflation instead of deflation now: higher wages and pushing raw materials prices up too.

They also touch the matter of China being one of the important drivers of "the Great Moderation" seen in the world in the last 30 years of slowing inflation in developed markets. Interesting.

Things are about to change?

This was what prompted the talk about buying long-term bonds in local currency in Brazil that I posted previously.

Will higher inflation corrode even the ridiculously high yields of brazilian sovereign bonds?


Stephen Jen's latest thoughts... on China going past its Lewis' Point and its consequences

 
*Disclaimer: charts and data are presented as I receive/see them. Sources are usually not checked for validation and my own calculations are of 'back of the envelope'-type. I am aware that some math that I do myself might be wrong and/or misleading to some extent. In financial markets the rate of change of economic data is often more important than the actual level and the perception of 'what is priced in' is more important than 'what is actually going to happen'. This is actually the way people pick entry and exit points. So... yes, sometimes you might say 'This guy is an idiot, this is way wrong!' with a high conviction, being right. Not to worry. Markets are made of expectations and the clash of conviction between its participants. Portfolio managers know that being an idiot is sometimes profitable and being smart is often a bad choice. It is all reality, sometimes good, sometimes bad. By the way: corrections to my analysis and intelligent debate is welcome. theintriguedtrader AT gmail do com

Bonds x Stocks starting in 1982. And the future.

A very interesting chart from Research Puzzle (ht Distressed Debt Investing): performance of the S&P 500, the Barcap Aggregate, 30yr US Treasuries (I would say the bond is rolled every once in a while to keep the duration stable) and Gold since 1982.

The bottom panel of the chart brings the yield on the 30-year US Treasury.

What will happen in the next 30 years?
Living in Brazil, with nominal sovereign yields in local currency at around 12.42% for Jan2021 (10-years) and inflation-linked yields @ 5.92% (Aug2050, 40 years) I really get to think about opportunity costs adjusted for volatility. Current inflation is running above 6% YoY. The inflation-target is 4.50% +/- 2% (so top of the band is 6.50%, we're there right now).

I quit having brazilian equities in July of last year and now with the SELIC rate at 12.25% (eff @ 12.17%) I really do not know when I will go back into equities. The forward P/E multiple for the Ibovespa is 9.88 with gives an yield of around 10%.

That means the stock index earns less than the nominal risk-free yield but with a lot more volatility and possible tail-risk/downside risk (global risk factors, mostly).

Do I believe we're in a global environment of multiple expansion? No.
Why?
- Current inflation in Brazil is hovering the top of the central bank's band.
- The quality of the inflation is horrible. It is a lot of service inflation that has a very strong inertia. It is not just commodities, raw food prices or fuel.
- Inflation expectations are very high too, especially compared to previous year's behavior when expectations were well anchored.
- The global environment is hostile. I don't buy the Chinese immortality case and I don't like the European Debt problems
- I do not like the US story either.

So...

Now some analysis of the future:

Brazil did grow 7.5% in 2010, but that was on the back of low growth in 2009, with massive fiscal stimulus in Brazil and worldwide, from a lower base, with low inflation and a come back in agricultural commodity prices.
Foreign flows have already made the brazilian stocks not so cheap (P/E > 9 x high bond yields). It has been a great 10-year run with inflation lower and lower and booming global growth on the back of unprecedented credit growth everywhere.

So... if you look around the world it seems like a no-brainer. "Let's buy these bonds and head to the beach". Brazil has the highest real-yields in the world, by far.

BUT....

In 2008, during the financial crisis, the yields on long-term (12-year fixed rate and 35-year inflation-linked) brazilian sovereign bonds in BRL spiked higher as foreigners fled the market. And I mean HIGHER. There was a rush to the exit-door of Braziland and these yields widened like 500bps. What a hit to bond holders. Then.. they collapsed as liquidity issues eased and the economic activity back-drop looked terrible.

... so that's (1) : Mark-to-Market

And now (2): Will inflation be as mild as it was in the US from 1982 until now?
A lot of people talk about hyperinflation. I am more of a deflationist type. Believing that DM-deleveraging will hurt growth and depress prices globally. But will commodities remain stable? Will food prices spike even higher? It has been a nice run already for corn, soybeans, wheat and others since the early 2000's.

What do you think?

Adding (1) and (2)... will we see another crisis that will make bond-yields sky-rocket (probably if the BRL gets crushed as it did, from 1.55/USD to 2.60/USD)? That would be the "best of two-worlds". But if the global backdrop looks worse than now I believe these yields will drop further and this time they won't skyrocket again.


*Disclaimer: charts and data are presented as I receive/see them. Sources are usually not checked for validation and my own calculations are of 'back of the envelope'-type. I am aware that some math that I do myself might be wrong and/or misleading to some extent. In financial markets the rate of change of economic data is often more important than the actual level and the perception of 'what is priced in' is more important than 'what is actually going to happen'. This is actually the way people pick entry and exit points. So... yes, sometimes you might say 'This guy is an idiot, this is way wrong!' with a high conviction, being right. Not to worry. Markets are made of expectations and the clash of conviction between its participants. Portfolio managers know that being an idiot is sometimes profitable and being smart is often a bad choice. It is all reality, sometimes good, sometimes bad. By the way: corrections to my analysis and intelligent debate is welcome. theintriguedtrader AT gmail do com

Monday, June 27, 2011

James Montier (now at GMO) - An Ode to the Joy of Cash

I'm going to read this on my way home, but I strongly recommend material written by James Montier.
From his days at SocGen or his books.

If the file is not available on the link below you can e-mail me and I will send it over.
Best regards.

GMO - James Montier - A Value Investor's Perspective on Tail Risk Protection: An Ode to the Joy of Cash
*Disclaimer: charts and data are presented as I receive/see them. Sources are usually not checked for validation and my own calculations are of 'back of the envelope'-type. I am aware that some math that I do myself might be wrong and/or misleading to some extent. In financial markets the rate of change of economic data is often more important than the actual level and the perception of 'what is priced in' is more important than 'what is actually going to happen'. This is actually the way people pick entry and exit points. So... yes, sometimes you might say 'This guy is an idiot, this is way wrong!' with a high conviction, being right. Not to worry. Markets are made of expectations and the clash of conviction between its participants. Portfolio managers know that being an idiot is sometimes profitable and being smart is often a bad choice. It is all reality, sometimes good, sometimes bad. By the way: corrections to my analysis and intelligent debate is welcome. theintriguedtrader AT gmail do com

Legg Mason's Michael Mauboussin

One of those simple videos with basic concepts that we have to keep in mind everyday.
Legg Mason Michael Mauboussin was interviewed by Consuelo Mack of Wealthtrack.


*Disclaimer: charts and data are presented as I receive/see them. Sources are usually not checked for validation and my own calculations are of 'back of the envelope'-type. I am aware that some math that I do myself might be wrong and/or misleading to some extent. In financial markets the rate of change of economic data is often more important than the actual level and the perception of 'what is priced in' is more important than 'what is actually going to happen'. This is actually the way people pick entry and exit points. So... yes, sometimes you might say 'This guy is an idiot, this is way wrong!' with a high conviction, being right. Not to worry. Markets are made of expectations and the clash of conviction between its participants. Portfolio managers know that being an idiot is sometimes profitable and being smart is often a bad choice. It is all reality, sometimes good, sometimes bad. By the way: corrections to my analysis and intelligent debate is welcome. theintriguedtrader AT gmail do com

The reason US Payrolls haven't collapsed

... is that there's not room for more cuts.

The gains in productivity in the U.S. have been massive since the crisis began. A lot less people employment and increasing output since the worst days of the crisis in 2009.

And the Non Farm Payroll monthly numbers have come in positive for many months.
If the economy was doing well I am sure labor mobility would be better.

Check out the 4 charts below.
Two of them regarding people who are voluntarily leaving their jobs, say, to seek better opportunities, follow their family elsewhere or simply lay back and party.
The QUITS show that we're better than 2009, yes, but barely. From the lows of late 2003 the 12m-rolling average is 25% below... and only 10% above 2009's lows. The raw NSA number... we're still way below the 2001-2008 range.

Are people afraid they won't get anything better in case they quit? Are people just not finding anything that would make them quit?


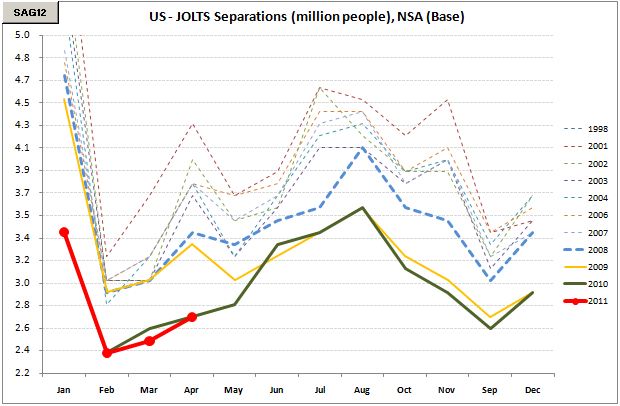
Now let's take a look at total separations (quits, retiring people, lay offs). We're still stuck at the lows.
In whatever metric you look at.
So people don't want to quit.
People don't want to kick back at home retired.
And businesses don't seem to be able to shed even more jobs.

These charts don't paint a very healthy picture of the american employment situation.


*Disclaimer: charts and data are presented as I receive/see them. Sources are usually not checked for validation and my own calculations are of 'back of the envelope'-type. I am aware that some math that I do myself might be wrong and/or misleading to some extent. In financial markets the rate of change of economic data is often more important than the actual level and the perception of 'what is priced in' is more important than 'what is actually going to happen'. This is actually the way people pick entry and exit points. So... yes, sometimes you might say 'This guy is an idiot, this is way wrong!' with a high conviction, being right. Not to worry. Markets are made of expectations and the clash of conviction between its participants. Portfolio managers know that being an idiot is sometimes profitable and being smart is often a bad choice. It is all reality, sometimes good, sometimes bad. By the way: corrections to my analysis and intelligent debate is welcome. theintriguedtrader AT gmail do com

Friday, June 24, 2011

Weekly Recap, 2011 06 24

Another week and the European debt issue goes on.
What has changed? In my opinion nothing changed regarding fundamentals and drivers of positions. It actually got a bit worse because the cost of rolling debt or issuing new debt has gotten worse.

Why? Simply because what happened is what everyone expected would happen: policy makers trying to cool the fire. Even though the voting in Greece was positive and the news that the Greek government and the IMF have struck a deal on what the austerity program will be in order for the Greeks to get the aid.

And markets and the funding costs?
Well, as the price board below shows the markets have not calmed.
- Sovereign Bond yields for Italy, Spain, Portugal (and the others) have gone up and broke resistances to the upside.
- Rates derivatives demonstrated an increase in stress in short-term funding markets, widening 5bps (Sep11 and Dec11 USD 3m Libor futures).
- The EUR took a beating
- The European Financial Index lost almost 4% this week.

As Albert Edwards quoted others here the whole issue is in the hands of politicians from debtor and creditor nations. And it takes only a handful of people to go against all the austerity programs or bailout programs with taxpayer money to ruin it all.
Argentina did it.
Iceland did it.
Greece didn't because they do not have their currency. Otherwise I believe they would have already done it.


Now those useless charts on weekly data:


*Disclaimer: charts and data are presented as I receive/see them. Sources are usually not checked for validation and my own calculations are of 'back of the envelope'-type. I am aware that some math that I do myself might be wrong and/or misleading to some extent. In financial markets the rate of change of economic data is often more important than the actual level and the perception of 'what is priced in' is more important than 'what is actually going to happen'. This is actually the way people pick entry and exit points. So... yes, sometimes you might say 'This guy is an idiot, this is way wrong!' with a high conviction, being right. Not to worry. Markets are made of expectations and the clash of conviction between its participants. Portfolio managers know that being an idiot is sometimes profitable and being smart is often a bad choice. It is all reality, sometimes good, sometimes bad. By the way: corrections to my analysis and intelligent debate is welcome. theintriguedtrader AT gmail do com

Add Mauldin to GK's Anatole and SocGen's Albert Edwards...

And you get a straight-forward piece.

I've mentioned before about the politics involved in this european debt-situation and this document by Albert Edwards sums it up nicely.

If you want the file let me know and I will forward it to you after people take it down from this link


*Disclaimer: charts and data are presented as I receive/see them. Sources are usually not checked for validation and my own calculations are of 'back of the envelope'-type. I am aware that some math that I do myself might be wrong and/or misleading to some extent. In financial markets the rate of change of economic data is often more important than the actual level and the perception of 'what is priced in' is more important than 'what is actually going to happen'. This is actually the way people pick entry and exit points. So... yes, sometimes you might say 'This guy is an idiot, this is way wrong!' with a high conviction, being right. Not to worry. Markets are made of expectations and the clash of conviction between its participants. Portfolio managers know that being an idiot is sometimes profitable and being smart is often a bad choice. It is all reality, sometimes good, sometimes bad. By the way: corrections to my analysis and intelligent debate is welcome. theintriguedtrader AT gmail do com
Mort Zuckerman on the American Employment Situation

From ZeroHedge we landed on Mort Zuckerman's piece of U.S. Jobs.
It is a very interesting piece, indeed.

I'd like to show some charts to illustrate his point.
JOLTS Openings, non-seasonally adjusted, both the Seasonal comparison and the YoY comparison.
So... might be temporary, but the trend doesn't look too good.
We're worse than last year. And that is after QE2, more fiscal stimulus, etc,etc.
The level on the 12-month rolling average is simply ridiculous. There's no need to even comment about it.

So.... read on after the charts.


Why the Jobs Situation Is Worse Than It Looks
We now have more idle men and women than at any time since the Great Depression

By Mortimer B. Zuckerman

Posted: June 20, 2011


The Great Recession has now earned the dubious right of being compared to the Great Depression. In the face of the most stimulative fiscal and monetary policies in our history, we have experienced the loss of over 7 million jobs, wiping out every job gained since the year 2000. From the moment the Obama administration came into office, there have been no net increases in full-time jobs, only in part-time jobs. This is contrary to all previous recessions. Employers are not recalling the workers they laid off from full-time employment.
Click here to find out more!

The real job losses are greater than the estimate of 7.5 million. They are closer to 10.5 million, as 3 million people have stopped looking for work. Equally troublesome is the lower labor participation rate; some 5 million jobs have vanished from manufacturing, long America's greatest strength. Just think: Total payrolls today amount to 131 million, but this figure is lower than it was at the beginning of the year 2000, even though our population has grown by nearly 30 million. [Check out a roundup of political cartoons on the economy.]

The most recent statistics are unsettling and dismaying, despite the increase of 54,000 jobs in the May numbers. Nonagricultural full-time employment actually fell by 142,000, on top of the 291,000 decline the preceding month. Half of the new jobs created are in temporary help agencies, as firms resist hiring full-time workers.

Today, over 14 million people are unemployed. We now have more idle men and women than at any time since the Great Depression. Nearly seven people in the labor pool compete for every job opening. Hiring announcements have plunged to 10,248 in May, down from 59,648 in April. Hiring is now 17 percent lower than the lowest level in the 2001-02 downturn. One fifth of all men of prime working age are not getting up and going to work. Equally disturbing is that the number of people unemployed for six months or longer grew 361,000 to 6.2 million, increasing their share of the unemployed to 45.1 percent. We face the specter that long-term unemployment is becoming structural and not just cyclical, raising the risk that the jobless will lose their skills and become permanently unemployable. [See a slide show of the 10 best cities to find a job.]

Don't pay too much attention to the headline unemployment rate of 9.1 percent. It is scary enough, but it is a gloss on the reality. These numbers do not include the millions who have stopped looking for a job or who are working part time but would work full time if a position were available. And they count only those people who have actively applied for a job within the last four weeks.

Include those others and the real number is a nasty 16 percent. The 16 percent includes 8.5 million part-timers who want to work full time (which is double the historical norm) and those who have applied for a job within the last six months, including many of the long-term unemployed. And this 16 percent does not take into account the discouraged workers who have left the labor force. The fact is that the longer duration of six months is the more relevant testing period since the mean duration of unemployment is now 39.7 weeks, an increase from 37.1 weeks in February. [See a slide show of the 10 cities with highest real income.]

The inescapable bottom line is an unprecedented slack in the U.S. labor market. Labor's share of national income has fallen to the lowest level in modern history, down to 57.5 percent in the first quarter as compared to 59.8 percent when the so-called recovery began. This reflects not only the 7 million fewer workers but the fact that wages for part-time workers now average $19,000—less than half the median income.

Just to illustrate how insecure the labor movement is, there is nobody on strike in the United States today, according to David Rosenberg of wealth management firm Gluskin Sheff. Back in the 1970s, it was common in any given month to see as many as 30,000 workers on the picket line, and there were typically 300 work stoppages at any given time. Last year there were a grand total of 11. There are other indirect consequences. The number of people who have applied for permanent disability benefits has soared. Ten years ago, 5 million people were collecting federal disability payments; now 8 million are on the rolls, at a cost to taxpayers of approximately $120 billion a year. The states today owe the federal insurance fund an astonishing $90 billion to cover unemployment benefits. [See cartoons about the deficit and debt.]

In past recessions, the economy recovered lost jobs within 13 months, on average, after the trough. Twenty-three months into a recovery, employment typically increases by around 174,000 jobs monthly, compared to 54,000 this time around. In a typical recovery, we would have had several hundred thousand more hires per month than we are seeing now—this despite unprecedented fiscal and monetary stimulus (including the rescue of the automobile industry, whose collapse would likely have lost a million jobs). Businesses do not seem to have the confidence or the incentive to add staff but prefer to continue the deep cost-cutting they undertook from the onset of the recession.

But hang on. Even to come up with the 54,000 new jobs, the Bureau of Labor Statistics assumed that 206,000 jobs were created by newly formed companies that its analysts believe—but can't prove—were, in effect, born in May under the so-called birth/death model, which relies primarily on historical extrapolations. Without this generous assumption in the face of a slowing economy, the United States would have lost jobs in May. Last year the bureau assumed that 192,000 jobs were created through new start-ups in the comparable month, but on review most of them eventually had to be taken out, as start-ups have been distressingly weak given the lack of financing from their traditional sources such as bank loans, home equity loans, and credit card lines. [Read more stories on unemployment.]

Where are we today? We have seemingly added jobs, but it is not because hiring has increased. In February 2009 there were 4.7 million separations—that is, jobs lost—but by March 2011 this had fallen to 3.8 million. In other words, the pace of layoffs has diminished, but that is not the same thing as more hiring. The employment numbers look better than they really are because of the aggressive layoffs in the early part of this recession and the reluctance of American business to rehire workers. In fact, the apparent improvement in job numbers has been made up of one part extra hiring and two parts reduced firing.

Even during past recessions, American firms still hired large numbers of workers as part of the continual cycle of replacing employees. Of the 150 million workers or job seekers in America, about one third turn over in a typical year, leaving their old jobs to take new ones. High labor "churn" is characteristic of our economy, reflecting workers moving to better jobs and higher wages and away from declining sectors. As Stanford business professor Edward Lazear explains so clearly in the Wall Street Journal, the increase in job growth over the past two years is attributable to a decline in the number of layoffs, not from increased hiring. Typically, when the labor market creates 200,000 jobs, it has been because 5 million were hired and 4.8 million were separated, not just because there were 200,000 hires and no job losses. But when an economy has bottomed out, it has already shed much of its excess labor, as illustrated by the decline in layoffs—from approximately 2.5 million in February 2009 to 1.5 million this April. In a healthy labor market like the one that prevailed in 2006 and into 2007, American firms hired about 5.5 million workers per month. This is now down to about 4 million a month. Quite simply, businesses have been very disciplined in their hiring practices. [Read Zuckerman: America's Fading Exceptionalism.]

We are nowhere near the old normal. Throughout this fragile recovery, over 90 percent of the growth in output has come from productivity gains. But typically at this stage of the cycle, labor has already taken over from productivity as the major contributor of growth. That is why we generally saw nonfarm payroll gains exceeding 300,000 per month with relative ease. This time we have recouped only 17 percent of the job losses 23 months after the recession began, as compared to 207 percent of the jobs lost from previous recessions (with the exception of 2001). There is no comfort either in two leading indicators of employment, with no growth in the workweek or in factory overtime.

Clearly, the Great American Job Machine is breaking down, and roadside assistance is not on the horizon. In the second half of this year (and thereafter?), we will be without the monetary and fiscal steroids. Nor does anyone know what will happen to long-term interest rates when the Federal Reserve ends its $600 billion quantitative easing support of the capital markets. Inventory levels are at their highest since September 2006; new order bookings are at the lowest levels since September 2009. Since home equity has long been the largest asset on the balance sheet of the average American family, all home­owners are suffering from housing prices that have, on average, declined 33 percent (compare that to the Great Depression drop of 31 percent). [See a slide show of the 10 cities with the lowest real income.]

No wonder the general economic mood is one of alarm. The Conference Board measure of U.S. consumer confidence slumped to 60.8 percent in May, down from 66 percent in April and well below the average of 73 in past recessions, never mind the 100-plus numbers in good times. Never before has confidence been this low in the 23rd month of a recovery. Gluskin Sheff's Rosenberg captured it perfectly: We may well be in the midst of a "modern depression."

Our political leadership in both Congress and the White House will surely bear the political costs of a failure to work out short- and long-term programs to fix the job shortage. The stakes are too high to play political games.
*Disclaimer: charts and data are presented as I receive/see them. Sources are usually not checked for validation and my own calculations are of 'back of the envelope'-type. I am aware that some math that I do myself might be wrong and/or misleading to some extent. In financial markets the rate of change of economic data is often more important than the actual level and the perception of 'what is priced in' is more important than 'what is actually going to happen'. This is actually the way people pick entry and exit points. So... yes, sometimes you might say 'This guy is an idiot, this is way wrong!' with a high conviction, being right. Not to worry. Markets are made of expectations and the clash of conviction between its participants. Portfolio managers know that being an idiot is sometimes profitable and being smart is often a bad choice. It is all reality, sometimes good, sometimes bad. By the way: corrections to my analysis and intelligent debate is welcome. theintriguedtrader AT gmail do com

Would a German CDS steepener be worth it?

I have spoken before about buying 5y German CDS @ 40bps and still like the idea very much.
Since this bet could take sometime to pay off there is another way to work on this trade which is the steepener.

What are the downsides on the outright long German 5y CDS:
1. Its price going down, of course, out of a 5y duration
2. The play going nowhere for quite sometime and you having to disburse the insurance premium of 40bps/year (which is cheap)

So if you do not like (2) above, as this fight is against policy makers, banks, socialist-capitalism (that transfers bank losses to tax payers), because we do not know WHEN it could actually work selling 2y German protection as a source of funding might look interesting.

Live market prices now are:
2y German CDS: bid @ 17bp
5y German CDS: offer @ 46bp

You do it duration weighted:
Sell 50m 2y @ 17 = receiving 85k USD/year
Buy 20m 5y @ 46 = paying 92k USD/year
Net cost, per year = 7k USD.

Catastrophe Scenario
- Germany defaults overnight: net exposure is 30m USD (50m short x 20m long)
Probability: very low as the German fiscal situation is 'healthy'. Their debt levels are low, their ongoing fiscal gap is reasonable and activity, even though super leveraged to global trade/exports, is very good.
What could change: Greece defaults and german banks get wiped out and global trade comes to a halt
What is bad: they have Euros and they can't print Euros like the US or Japan can, really fast.

My point is: if this Catastrophe Scenario happened overnight YES, the trade would get crushed and the risk-reward would be ridiculously bad.
BUT I really do not think this would happen overnight and things would deteriorate gradually giving us time to exit the trade

An unlikely scenario, but more likely then german default scenario, is things get sour quickly and the German curves goes inverted way too fast.. Two-year spreads go up faster than the 5y-spreads. That is a stop-loss even though you believe the fundamentals backing the trade are sound.
What could make this scenario dangerous is the fact that 2y German CDS spreads are way too low in absolute terms. That's 17bps. Someone who wants to put in their books catastrophe-like hedges that are extremely cheap.. could just outright buy these 1y or 2y babies. This actually bothers me, making me like the 5y-outright-long a lot.

So what is the most-likely scenario in my opinion:

Things keep on deteriorating despite all the talk of "we're OK" from policy makers.
Italian and Spanish sovereign debt goes bad... and slowly Germany is brought into the mess to save everyone else, alongside with France, backing all these packages.
French CDS have already gone a bit wild. It came from sub-70bps to almost 90bps and the same 2y/5y steepener traded at 35 and is now above 50bp levels.
Sounds like a pattern to me. Sounds interesting.

*Disclaimer: charts and data are presented as I receive/see them. Sources are usually not checked for validation and my own calculations are of 'back of the envelope'-type. I am aware that some math that I do myself might be wrong and/or misleading to some extent. In financial markets the rate of change of economic data is often more important than the actual level and the perception of 'what is priced in' is more important than 'what is actually going to happen'. This is actually the way people pick entry and exit points. So... yes, sometimes you might say 'This guy is an idiot, this is way wrong!' with a high conviction, being right. Not to worry. Markets are made of expectations and the clash of conviction between its participants. Portfolio managers know that being an idiot is sometimes profitable and being smart is often a bad choice. It is all reality, sometimes good, sometimes bad. By the way: corrections to my analysis and intelligent debate is welcome. theintriguedtrader AT gmail do com

Policy Makers Give Answers. Markets Grade Them.

Human beings, those behind market movements, are a curious kind.
Was there any important news yesterday to cause the sell-off?
Was there any important news yesterday to cause the rally in the afternoon?

In my humble opinion there wasn't.
First of all we all know already that Greece is insolvent.
Second, every one knows that policy makers will try really hard to keep the ball rolling. Forever.

European policy makers (and the IMF crew, the banks, the Fed, China) will fight for austerity for now, no matter what the consequences are for Greece's growth. Or global inflation. Or the CNYSEK currency cross. That is obvious.
Everyone is worried about the global banking system and (as R.E.M. put it: ) the end of the (capitalist) world as we know it.

Policy Makers are putting moral hazard aside and, learning from the Lehman collapse and its shockwaves, will force any thing possible, within their means, to keep the ball rolling.

Only market prices will solve the european solvency issues. And if the issue's solution is forced by the markets, yes, things won't look good at all.

So.... some charts for you:


*Disclaimer: charts and data are presented as I receive/see them. Sources are usually not checked for validation and my own calculations are of 'back of the envelope'-type. I am aware that some math that I do myself might be wrong and/or misleading to some extent. In financial markets the rate of change of economic data is often more important than the actual level and the perception of 'what is priced in' is more important than 'what is actually going to happen'. This is actually the way people pick entry and exit points. So... yes, sometimes you might say 'This guy is an idiot, this is way wrong!' with a high conviction, being right. Not to worry. Markets are made of expectations and the clash of conviction between its participants. Portfolio managers know that being an idiot is sometimes profitable and being smart is often a bad choice. It is all reality, sometimes good, sometimes bad. By the way: corrections to my analysis and intelligent debate is welcome. theintriguedtrader AT gmail do com

Tuesday, June 21, 2011

Greece 'Essentially Bankrupt' Even With Aid, PIMCO's Balls


I ask myself every once in a while: "What would I do if I were a policy maker in Europe right now?".

It is such a puzzling question because these are well-educated guys who have a huge networking to source point-of-views. They hear a variety of opinions from the likes of politicians, business men, academics, investors, among others and I really believe they know there is no way out of a debt restructuring for the peripherals (considering that once Greece goes the tide comes bringing the rest down to their knees).

What would I do?
Will the Greek people, through their politicians, really let austerity come in harder than it is actually already going?
The creditors didn't worry much about the solvency of the Greek people when they lent the money. Now the situation is so serious that even the Greeks have to think what will happen if they didn't pay back what they owe.
If there is a default would the new global banking + financial crisis make things even worse for stand-alone Greece?
Would the Greeks be better-off defaulting, staring at the financial-crisis-abyss that would ensue, leaving the Eurozone and the Euro currency, with the world in chaos after spending another few depressed years to get their currency back, etc?

I do not know.
But I certainly am happy not to be an european finance minister right now.
Good luck to these guys because the matter they have in their hands is, from my point of view, key to the future of our financial system as we know it.

(I know, the current system sucks).

PIMCO Andrew Balls - The Eurozone Needs a Plan B, as 'Quarantining' the Weak Is Too Costly

Greece ‘Essentially Bankrupt’ Even With Aid, Says Pimco’s Balls
2011-06-21 15:59:06.377 GMT


By Mark McCord
     June 21 (Bloomberg) -- Greece is “essentially bankrupt”
and any attempts to solve its sovereign crisis with a new bailout will be like “kicking the can down the road,” said Andrew Balls, Pacific Investment Management Co.’s head of European portfolio management.
     Even if the nation is granted fresh aid “these issues are going to come up again in the next months,” Balls told Andrea Catherwood on Bloomberg Television today. It would be “complacent if investors think this can be kicked down the road until 2013,” he said.
     Greek Prime Minister George Papandreou faces a confidence vote today as he seeks to secure parliamentary support for austerity measures required for the granting of outside aid to prevent a default.
     Balls said the only benefit of a Papandreou victory would be to buy some time to prevent contagion spreading to other economies such as Spain’s.
     “The concern we have is that if you continue to kick the can down the road, you raise the risk of a disorderly default and worse contagion impact,” he said. “If you just told the truth and said Greece looks like it will need to restructure its debt” you could then “try and have a supportive orderly framework to do that.”

Link to Company News:{1841Z SM <Equity> CN <GO>} Link to Company News:{21429Z US <Equity> CN <GO>}

*Disclaimer: charts and data are presented as I receive/see them. Sources are usually not checked for validation and my own calculations are of 'back of the envelope'-type. I am aware that some math that I do myself might be wrong and/or misleading to some extent. In financial markets the rate of change of economic data is often more important than the actual level and the perception of 'what is priced in' is more important than 'what is actually going to happen'. This is actually the way people pick entry and exit points. So... yes, sometimes you might say 'This guy is an idiot, this is way wrong!' with a high conviction, being right. Not to worry. Markets are made of expectations and the clash of conviction between its participants. Portfolio managers know that being an idiot is sometimes profitable and being smart is often a bad choice. It is all reality, sometimes good, sometimes bad. By the way: corrections to my analysis and intelligent debate is welcome. theintriguedtrader AT gmail do com

Monday, June 20, 2011

Japanese trade data looking ugly

The Japanese Trade Data for the month of May was released over night and it does not look good.

In absolute terms the trade-deficit registered, non-seasonally adjusted, was the 2nd worst ever. It was beat by the peak-crisis number from  January 2009.

Looking at seasonally-adjusted data now we face some interesting pieces:

On Bloomberg the info is available since January 1993, around 220 observations.
Since then there were only 12 monthly deficits and, to our surprise, 10 of those happened during 2008's crisis and the remaining 2 were May and April 2011, after the earthquake+tsunami.

Below you will find tables and charts to illustrate what I mentioned above.

Of course there is a huge impact from the natural disasters and their consequences, but is Japan losing competitivity that will enhance the tragedies' effects?
Will ongoing supply-disruption from Japan make buyers of nipponese goods switch business counterparties? Will they source from other countries? Is the strong Yen making things worse for them?


*Disclaimer: charts and data are presented as I receive/see them. Sources are usually not checked for validation and my own calculations are of 'back of the envelope'-type. I am aware that some math that I do myself might be wrong and/or misleading to some extent. In financial markets the rate of change of economic data is often more important than the actual level and the perception of 'what is priced in' is more important than 'what is actually going to happen'. This is actually the way people pick entry and exit points. So... yes, sometimes you might say 'This guy is an idiot, this is way wrong!' with a high conviction, being right. Not to worry. Markets are made of expectations and the clash of conviction between its participants. Portfolio managers know that being an idiot is sometimes profitable and being smart is often a bad choice. It is all reality, sometimes good, sometimes bad. By the way: corrections to my analysis and intelligent debate is welcome. theintriguedtrader AT gmail do com

Friday, June 17, 2011

Weekly Recap, 2011 06 17

Another week and not a lot has changed.


Below some parts of e-mails I exchanged with friends regarding the European situation:

I like going long Germany CDS at current levels, 40bp.
I think this says it all.

Not that Germany will default, but compared to costs on limited risk bets with a 6month expiration (puts on DAX, SPX, EURxsomething) it seems cheap.

10yr spanish bonds broke today to the upside and Italian 10yr tested the break-out.
Irish, Portuguese and Greek debt yield made new highs...

Short term eurodollar futures yields (3m USD Libor) and TED-Spreads rose around 10-15bp the past few days which indicate a likely tightening in funding mkts..

The 3 french banks put under review by rtng agencies participate deeply in the CP/CD european mkt.. If they go....

We're in the hand of politicians and they will flip their finger at foreign banks/investors to 'save' their country.

The deposit base in Ireland and Greece is at the lows now I heard, dont remember the source or level.

Italian banks stocks are screwed, no technical supports in sight.. 
 And a reply to theirs:

Never underestimate the ability of politicians to waste other people’s money.
ABSOLUTELY. Take for example Iceland. Defaulted on British banks. Screw them!
Why would they have growth drop dramatically with necessary austerity measures because of German and French banks? That is what Greeks have in mind right now.
I know that Greek politicians know that financial chaos will come if Greece defaults, but they can just say “Hey, I don’t care! I’ll pay the price here, but everyone will share the burden!”

I do see the event of Greece leaving the Eurozone as positive for the Eurozone and fundamentally bullish for the Euro currency.
The problem becomes, then, the stability of the Eurozone being put to question.
If one country which is screwed fiscally can leave the Euro… others could too, perhaps if they are sound fiscally. This puts the soundness of the currency in check.
I wouldn’t want to be long this uncertainty at 1.25%/year in yields! Nor do I want to be long duration in sovereign European debt with this uncertainty on my portfolio.
For that I would do a basket of (USD+EUR+GBP) x (CAD/BRL/CLP/CHF/NOK) with a carry of around 4-5%/year and I’d hedge that tail risk with long USDCNY 3y calls… vols are crushed and there is also a positive carry on the USDCNY call (short CNY).
Stress would ensue and the basket, full of cyclical currencies, would suffer, but medium term, after total chaos, we would see recessions and money printing.. especially in America, Europe and the UK… so weakness all over again and a boost to EM/cyclical growth.


How cheap will be the bonds issued by the EFSF, backed in part by Spain/Italy/Ireland/Portugal/and stronger dudes? Why would anyone buy 10yr bonds ar 4% if a decent share of the guarantors (spelling?) of this debt trade at higher levels? I mean… the problem is solvency, not short-term liquidity.
I consider the EFSF a subprime CDO-squared. It is exponential-loss waiting to happen.

Domino effect.
If there is issue with bonds because of Greece… Greece isn’t part of it and larger slices of guarantee go to all the other countries (Port/Ire/Italy/Ger). Portuguese and Irish sovs yields go up.
If there is an issue with Portugal…. Greece and Portugal aren’t part of it… larger slices to Ger/Fra/Ita/Spa/Ire. Italian and Spanish yields go up.
If there is an issue with Ireland…. Greece, Portugal and Ireland aren’t part of it…

Until the whole burden falls on the back of France and Germany… and bang. Money printing (short EUR) or dead-bonds (long CDS/swap spreads).

And below those charts no one looks at.

I'd like to point out that WTI Crude, Shanghai Composite and Hang Seng stock indexes are now below 200-day moving averages and breaking long-term trend lines that started back in 2008-2009.
Commodities also took a beating and the CRB index is now at important support lines.

Charts:


*Disclaimer: charts and data are presented as I receive/see them. Sources are usually not checked for validation and my own calculations are of 'back of the envelope'-type. I am aware that some math that I do myself might be wrong and/or misleading to some extent. In financial markets the rate of change of economic data is often more important than the actual level and the perception of 'what is priced in' is more important than 'what is actually going to happen'. This is actually the way people pick entry and exit points. So... yes, sometimes you might say 'This guy is an idiot, this is way wrong!' with a high conviction, being right. Not to worry. Markets are made of expectations and the clash of conviction between its participants. Portfolio managers know that being an idiot is sometimes profitable and being smart is often a bad choice. It is all reality, sometimes good, sometimes bad. By the way: corrections to my analysis and intelligent debate is welcome. theintriguedtrader AT gmail do com