Showing posts with label job growth. Show all posts

Monday, June 27, 2011

The reason US Payrolls haven't collapsed

... is that there's not room for more cuts.

The gains in productivity in the U.S. have been massive since the crisis began. A lot less people employment and increasing output since the worst days of the crisis in 2009.

And the Non Farm Payroll monthly numbers have come in positive for many months.
If the economy was doing well I am sure labor mobility would be better.

Check out the 4 charts below.
Two of them regarding people who are voluntarily leaving their jobs, say, to seek better opportunities, follow their family elsewhere or simply lay back and party.
The QUITS show that we're better than 2009, yes, but barely. From the lows of late 2003 the 12m-rolling average is 25% below... and only 10% above 2009's lows. The raw NSA number... we're still way below the 2001-2008 range.

Are people afraid they won't get anything better in case they quit? Are people just not finding anything that would make them quit?


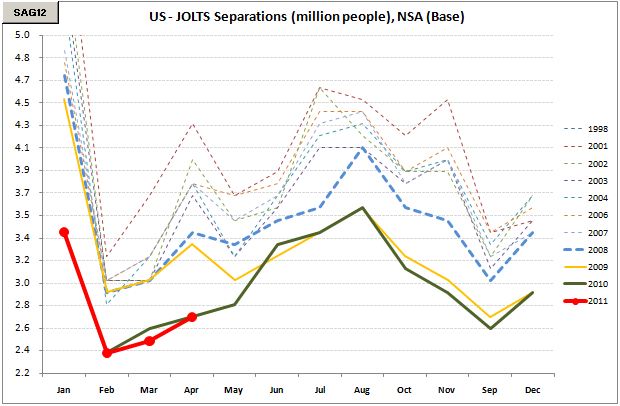
Now let's take a look at total separations (quits, retiring people, lay offs). We're still stuck at the lows.
In whatever metric you look at.
So people don't want to quit.
People don't want to kick back at home retired.
And businesses don't seem to be able to shed even more jobs.

These charts don't paint a very healthy picture of the american employment situation.


*Disclaimer: charts and data are presented as I receive/see them. Sources are usually not checked for validation and my own calculations are of 'back of the envelope'-type. I am aware that some math that I do myself might be wrong and/or misleading to some extent. In financial markets the rate of change of economic data is often more important than the actual level and the perception of 'what is priced in' is more important than 'what is actually going to happen'. This is actually the way people pick entry and exit points. So... yes, sometimes you might say 'This guy is an idiot, this is way wrong!' with a high conviction, being right. Not to worry. Markets are made of expectations and the clash of conviction between its participants. Portfolio managers know that being an idiot is sometimes profitable and being smart is often a bad choice. It is all reality, sometimes good, sometimes bad. By the way: corrections to my analysis and intelligent debate is welcome. theintriguedtrader AT gmail do com

Wednesday, June 15, 2011

NFIB still not too happy

And the outlook on jobs didn't improve.
Small and medium businesses, the drivers of job growth, haven't been able to add many positions and from the survey, won't help much either in the near future.


http://www.nfib.com/press-media/press-media-item?cmsid=57243

Consumer Spending Remains Weak:
Small Business Optimism Dips a Little Lower

WASHINGTON, June 14, 2011 – For the third consecutive month, NFIB’s Small Business Optimism Index fell. While the drop was slight—.3 points, with the index settling at 90.9 in May—the index makes clear that optimism is moving in the wrong direction: a recession-level reading for an economy fighting its way through a recovery. A leading cause of the low reading is the stubborn problem of weak consumer spending, which is especially problematic for services, a sector dominated by small businesses.

“Corporate profits may be at a record high, but businesses on Main Street are still scraping by,” said NFIB chief economist Bill Dunkelberg. “Washington is throwing misdirected policies at the problem, offering tax breaks for hiring and equipment investment, but acting surprised when they don’t bear any fruit. The failure to understand why small-business owners are not hiring or investing has resulted in a set of policies that have not been very effective, and Main Street is suffering. The icing on the cake: the growing debt, large deficits, threats of higher taxes, regulations being spewed out by state and local administrations, and the uncertainty of the new health care law—is it any wonder that optimism is down?”

For the third month running, several key economic indicators continued their downward tumble. Job market indicators continued to deteriorate, anticipating very weak job creation and a higher unemployment rate. Capital spending plans and inventory investment plans all weakened and remain at recession levels. Inflation continues to rise, a notable business concern for owners who are raising their own prices at the fastest pace seen in years. And driving the economic uncertainty, one in four owners still report weak sales as their top business problem (followed by taxes and regulations and red tape, only 3 percent cite financing).

Some other highlights of May’s Optimism Index include:

•    For small firms, the average employment change was +0.01 employees (per firm) over the past three months, or virtually zero. Twelve percent (seasonally adjusted) reported unfilled job openings, down 2 points and a clear signal that unemployment rates will rise. Over the next three months, 13 percent plan to increase employment (down 3 points from April, down 5 points from March), and 8 percent plan to reduce their workforce (up 2 points), yielding a seasonally adjusted net negative 1 percent of owners planning to create new jobs.

•    Only 5 percent of the owners view the current period as a good time to expand; of those who view it as a bad time to expand, 71 percent of those blame the weak economy, and 14 percent cite political uncertainty.  The net percent of owners expecting better business conditions in six months was a negative 5 percent, 15 percentage points lower than January.

•    Capital spending remains historically low in spite of very low interest rates and all sorts of expensing incentives. Fifty percent of firms reported making capital expenditures over the past six months, and the percent of owners planning capital outlays in the next 3 to 6 months fell 1 point to 20 percent, a recession level reading.

•    Sales are down; the net percent of all owners (seasonally adjusted) reporting higher nominal sales over the past three months lost 4 percentage points, falling to a net negative 9 percent, with more firms with sales trending down than up.  Unadjusted, 23 percent of all owners reported higher sales (last three months compared to prior three months, up 1 point) while 36 percent reported lower sales (unchanged). The net percent of owners expecting higher real sales fell 2 points to a net 3 percent of all owners (seasonally adjusted), 10 points below January’s reading.

•    The seasonally adjusted net percent of owners raising average selling prices reached 15 percent,  up 3 points. Thirty-one percent reported raising average selling prices which is twice the percent of owners who are cutting prices, suggesting that average price levels will be rising, or inflation.

Today’s report is based on the responses of 733 randomly sampled small businesses in NFIB’s membership, surveyed throughout the month of May. Download the complete study at http://www.nfib.com/sbetindex.

###

NFIB’s Small Business Economic Trends is a monthly survey of small-business owners’ plans and opinions. Decision makers at the federal, state and local levels actively monitor these reports, ensuring that the voice of small business is heard. The NFIB Research Foundation conducts some of the most comprehensive research of small-business issues in the nation. The National Federation of Independent Business is the nation’s leading small-business association. A nonprofit, nonpartisan organization founded in 1943, NFIB represents the consensus views of its members in Washington, D.C., and all 50 state capitals.

*Disclaimer: charts and data are presented as I receive/see them. Sources are usually not checked for validation and my own calculations are of 'back of the envelope'-type. I am aware that some math that I do myself might be wrong and/or misleading to some extent. In financial markets the rate of change of economic data is often more important than the actual level and the perception of 'what is priced in' is more important than 'what is actually going to happen'. This is actually the way people pick entry and exit points. So... yes, sometimes you might say 'This guy is an idiot, this is way wrong!' with a high conviction, being right. Not to worry. Markets are made of expectations and the clash of conviction between its participants. Portfolio managers know that being an idiot is sometimes profitable and being smart is often a bad choice. It is all reality, sometimes good, sometimes bad. By the way: corrections to my analysis and intelligent debate is welcome. theintriguedtrader AT gmail do com

Monday, June 6, 2011

NFIB doesn't look optimistic on jobs.

 And those small and medium businesses that really generate the much wanted job growth... and this is quite serious if you consider that these are the guys who actually do the difference in the long run.

http://www.nfib.com/nfib-on-the-move/nfib-on-the-move-item?cmsid=57186

www.NFIB.com
For Immediate Release

Contact: Cynthia Magnuson, 202-314-2036 or cynthia.magnuson@nfib.org

WASHINGTON, D.C., June 2, 2011
— Chief economist for the National Federation of Independent Business (NFIB) William C. Dunkelberg, issued the following statement on May job numbers, based on NFIB’s monthly economic survey that will be released on Tuesday, June 14, 2011. The survey was conducted in May and reflects 733 randomly-sampled small-business owner respondents:

“After solid job gains early in the year, progress has slowed to a trickle. The two NFIB indicators—job openings and hiring plans—that predict the unemployment rate both fell, suggesting that the rate itself will rise. 

“May’s job numbers will disappoint; meaningful job creation on Main Street has collapsed. 

“Twelve percent (seasonally adjusted) of small-business owners reported unfilled job openings (down 2 points). Further indications of minimal future growth include the fact that in the next three months, 13 percent plan to increase employment (down 3 points), and 8 percent plan to reduce their workforce (up 2 points). That yields a seasonally adjusted net negative 1 percent of owners planning to create new jobs, a 3 point loss from April.

“Overall, reports of job reductions have returned to historically normal levels. However, the percent of owners hiring has not recovered to levels historically observed after two years of expansion. With one in four owners still reporting ‘weak sales’ as their  No. 1 business problem, there is little need to add employees, especially with the uncertainty about future labor costs arising from new regulation and legislation. And, if Congress doesn’t deal effectively with the trillion dollar deficit, we’ve got plenty to keep us worried.” 


*Disclaimer: charts and data are presented as I receive/see them. Sources are usually not checked for validation and my own calculations are of 'back of the envelope'-type. I am aware that some math that I do myself might be wrong and/or misleading to some extent. In financial markets the rate of change of economic data is often more important than the actual level and the perception of 'what is priced in' is more important than 'what is actually going to happen'. This is actually the way people pick entry and exit points. So... yes, sometimes you might say 'This guy is an idiot, this is way wrong!' with a high conviction, being right. Not to worry. Markets are made of expectations and the clash of conviction between its participants. Portfolio managers know that being an idiot is sometimes profitable and being smart is often a bad choice. It is all reality, sometimes good, sometimes bad. By the way: corrections to my analysis and intelligent debate is welcome. theintriguedtrader AT gmail do com

Wednesday, May 18, 2011

More Jobs needed for those Claims

This post was also missing in the draft box after Blogger's technical issue last week.
------------------------

Ladies, good morning. Slept alright?

So... this morning we got what I mentioned is a much more reliable job-growth indicator.
The Initial Jobless Claims came at +434k, slightly above market expectations of 430k and last week's surge was revised upwards 4k to +478k.

Beauty pieces below:


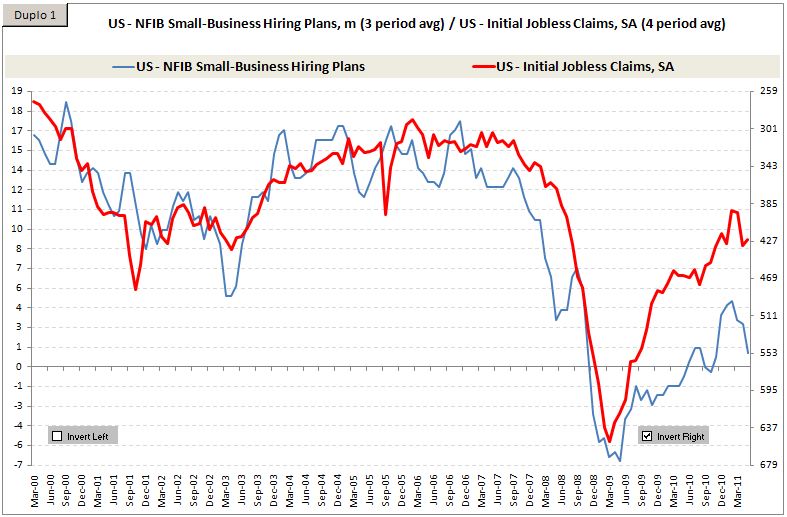
My reading of these charts, and perhaps I have this reading because economists mention it, is that average IJC above 400k/week is not positive for job growth.

I charted them together and it seems to, at least, make sense.
If the +400k is the threshold I am really not sure. But, woman, listen to me, these charts, from 1990, tell me that the current level of +437k for the 4-week average is INCOMPATIBLE with 244k NFP monthly growth (April's number) and not even compatible with POSITIVE job growth.

But that's me speaking. I am no economist. I am not adjusting numbers since 1990 for population growth, etc.
I'm just thinking through writing. Organizing my ideas.

EM Equity markets started the way down... through high inflation and an on-going hiking cycle. The Brazilian Ibovespa is claiming 10-month lows. If you discount if by the local CDI risk-free you get a negative 8-10% return for the period. On the way up it was Sep09 when the index hit 63k points.
Commodities then came at us in recent weeks. Comex Copper made highs around 460 earlier in the year... now back to 390, 15% drop. Back to Nov10 levels.
Crude is still way above last-year levels, but dropped a good 15% from the highs.

And that is with rent prices going up in the US. Housing prices marking a double-dip (CoreLogic: House Prices declined 1.5% in March, Prices now 4.6% below 2009 Lows), a surge in Initial Jobless Claims (4wk avg @ Nov10 levels), US average AAA Gas Prices almost 30% from Dec 2010 levels.

I know that corporate earnings came strong for 1Q11 providing room for the S&P 500 equity index to be at current levels, but people say (read Jeremy Grantham from GMOs post from yesterday) margins are peaking or already peaked and, as Vitaly Katselnelson says, we're not in period of hitting offers in terms of P/E multiples. We're in a period of contracting multiples or at least side-ways multiples.

There is a lot of uncertainty in the global economic outlook. You all know those already so I won't repeat them. Be prudent, don't chase stretched rallies, be selective on what you buy, think independently, study very hard. And worry about the return OF your capital and not only about the return ON your capital. Always worry.

Best regards,
The Intrigued Trader


*Disclaimer: charts and data are presented as I receive/see them. Sources are usually not checked for validation and my own calculations are of 'back of the envelope'-type. I am aware that some math that I do myself might be wrong and/or misleading to some extent. In financial markets the rate of change of economic data is often more important than the actual level and the perception of 'what is priced in' is more important than 'what is actually going to happen'. This is actually the way people pick entry and exit points. So... yes, sometimes you might say 'This guy is an idiot, this is way wrong!' with a high conviction, being right. Not to worry. Markets are made of expectations and the clash of conviction between its participants. Portfolio managers know that being an idiot is sometimes profitable and being smart is often a bad choice. It is all reality, sometimes good, sometimes bad. By the way: corrections to my analysis and intelligent debate is welcome. theintriguedtrader AT gmail do com

Wednesday, May 11, 2011

Confirming-NFP JOLTS and its momentum

Ladies... here we are again with the JOLTS. On the last data-release we came up with this analysis. Now we take a look at the March numbers.

The trend seems unchanged: improvement.
Remember that the JOLTS is released with a 1-month lag to NFP.

The NFP-like, SA, March number (Hires - Separations) looks good, like the NFP released in March.


But I'd like to look at the NFP-Like number, non-seasonally-adjusted-12-month change. The path in this number indicates the momentum in job growth, not levels. Reduced momentum despite decent levels?


The chart below is the 4-month acum, NSA, 3-month change (tough, huh?). There's seasonallity, so we'll compare apples with apples.

What is important to check on this chart is the distance between years. In late 2010 we saw a closing gap. 2010 was rising faster than 2009. The Dec-10 print was 27k higher than 2009. Great.
But since January this number came in negative and the distance to the previous year's metric has also been getting more negative/peaked, even though better than all years but 2010 and 2001.
2010 vs Aug09 (1,826) distance from last year (517)
2010 vs Sep09 (2,172) distance from last year (346)
2010 vs Oct09 (1,348) distance from last year  824 (top momentum?)
2010 vs Nov09   (628) distance from last year  720 
2010 vs Dec09     27  distance from last year  655 (peak?)
2011 vs Jan10   (134) distance from last year (161)
2011 vs Feb10   (265) distance from last year (131)
2011 vs Mar10   (424) distance from last year (159)


Again, strong NFP levels came in last Friday, revisions to the upside.
What I am worried with is the divergence between Household Survey x Stablishment (-190 x 250k~) and the recent surge in Initial Jobless claims.

If Household Survey + IJC are correct, coupled with these momentum charts above, the US 3.0% 2011 growth story is fairy tale.

*Disclaimer: charts and data are presented as I receive/see them. Sources are usually not checked for validation and my own calculations are of 'back of the envelope'-type. I am aware that some math that I do myself might be wrong and/or misleading to some extent. In financial markets the rate of change of economic data is often more important than the actual level and the perception of 'what is priced in' is more important than 'what is actually going to happen'. This is actually the way people pick entry and exit points. So... yes, sometimes you might say 'This guy is an idiot, this is way wrong!' with a high conviction, being right. Not to worry. Markets are made of expectations and the clash of conviction between its participants. Portfolio managers know that being an idiot is sometimes profitable and being smart is often a bad choice. It is all reality, sometimes good, sometimes bad. By the way: corrections to my analysis and intelligent debate is welcome. theintriguedtrader AT gmail do com
Tuesday, May 10, 2011

NFIB Small Business out

And down. Around the same level as last October.

Calculated Risk has some charts on this 


I read somewhere the other day some interesting statistics about job growth in the U.S.
It mentioned that large companies, in the long-run, actually destroy jobs: automation, robotics, outsourcing, etc.
It mentioned that small and medium businesses were actually the largest driver of job creation in the U.S.
So I bring this morning's NFIB Small Business Optimism Index.

It is 3.3 points below the recent high in February (2 months ago). It is lowe than the 6-month moving average that has just stabilized.
It is 9.2 points below the average of 2000-2007.
 
And the table below shows that some (in my opinion) key aspects of the index are making new recent lows (marked with a red 'X').
The second month in a row that people expect the economy to actually get worse, the worst expectations in at least 6 months.
Plans to hire at the lows of at least 6 months, expectations of higher sales also at the lowest... BUT higher selling prices at the highest in as many months.

Speaking of a consumer-squeeze, right?


*Disclaimer: charts and data are presented as I receive/see them. Sources are usually not checked for validation and my own calculations are of 'back of the envelope'-type. I am aware that some math that I do myself might be wrong and/or misleading to some extent. In financial markets the rate of change of economic data is often more important than the actual level and the perception of 'what is priced in' is more important than 'what is actually going to happen'. This is actually the way people pick entry and exit points. So... yes, sometimes you might say 'This guy is an idiot, this is way wrong!' with a high conviction, being right. Not to worry. Markets are made of expectations and the clash of conviction between its participants. Portfolio managers know that being an idiot is sometimes profitable and being smart is often a bad choice. It is all reality, sometimes good, sometimes bad. By the way: corrections to my analysis and intelligent debate is welcome. theintriguedtrader AT gmail do com