Showing posts with label US growth. Show all posts

Thursday, June 9, 2011

MacroAdvisers 2Q GDP @ 2.5%, down from 2.6%

And they come again.... another downgrade to US 2Q growth.

Drivers: despite better than expected Trade Balance (exports up, imports down), but offsetting negative revisions for equipment and software spending and inventory investment in motor vehicles and parts.


*Disclaimer: charts and data are presented as I receive/see them. Sources are usually not checked for validation and my own calculations are of 'back of the envelope'-type. I am aware that some math that I do myself might be wrong and/or misleading to some extent. In financial markets the rate of change of economic data is often more important than the actual level and the perception of 'what is priced in' is more important than 'what is actually going to happen'. This is actually the way people pick entry and exit points. So... yes, sometimes you might say 'This guy is an idiot, this is way wrong!' with a high conviction, being right. Not to worry. Markets are made of expectations and the clash of conviction between its participants. Portfolio managers know that being an idiot is sometimes profitable and being smart is often a bad choice. It is all reality, sometimes good, sometimes bad. By the way: corrections to my analysis and intelligent debate is welcome. theintriguedtrader AT gmail do com

Wednesday, May 18, 2011

More Jobs needed for those Claims

This post was also missing in the draft box after Blogger's technical issue last week.
------------------------

Ladies, good morning. Slept alright?

So... this morning we got what I mentioned is a much more reliable job-growth indicator.
The Initial Jobless Claims came at +434k, slightly above market expectations of 430k and last week's surge was revised upwards 4k to +478k.

Beauty pieces below:


My reading of these charts, and perhaps I have this reading because economists mention it, is that average IJC above 400k/week is not positive for job growth.

I charted them together and it seems to, at least, make sense.
If the +400k is the threshold I am really not sure. But, woman, listen to me, these charts, from 1990, tell me that the current level of +437k for the 4-week average is INCOMPATIBLE with 244k NFP monthly growth (April's number) and not even compatible with POSITIVE job growth.

But that's me speaking. I am no economist. I am not adjusting numbers since 1990 for population growth, etc.
I'm just thinking through writing. Organizing my ideas.

EM Equity markets started the way down... through high inflation and an on-going hiking cycle. The Brazilian Ibovespa is claiming 10-month lows. If you discount if by the local CDI risk-free you get a negative 8-10% return for the period. On the way up it was Sep09 when the index hit 63k points.
Commodities then came at us in recent weeks. Comex Copper made highs around 460 earlier in the year... now back to 390, 15% drop. Back to Nov10 levels.
Crude is still way above last-year levels, but dropped a good 15% from the highs.

And that is with rent prices going up in the US. Housing prices marking a double-dip (CoreLogic: House Prices declined 1.5% in March, Prices now 4.6% below 2009 Lows), a surge in Initial Jobless Claims (4wk avg @ Nov10 levels), US average AAA Gas Prices almost 30% from Dec 2010 levels.

I know that corporate earnings came strong for 1Q11 providing room for the S&P 500 equity index to be at current levels, but people say (read Jeremy Grantham from GMOs post from yesterday) margins are peaking or already peaked and, as Vitaly Katselnelson says, we're not in period of hitting offers in terms of P/E multiples. We're in a period of contracting multiples or at least side-ways multiples.

There is a lot of uncertainty in the global economic outlook. You all know those already so I won't repeat them. Be prudent, don't chase stretched rallies, be selective on what you buy, think independently, study very hard. And worry about the return OF your capital and not only about the return ON your capital. Always worry.

Best regards,
The Intrigued Trader


*Disclaimer: charts and data are presented as I receive/see them. Sources are usually not checked for validation and my own calculations are of 'back of the envelope'-type. I am aware that some math that I do myself might be wrong and/or misleading to some extent. In financial markets the rate of change of economic data is often more important than the actual level and the perception of 'what is priced in' is more important than 'what is actually going to happen'. This is actually the way people pick entry and exit points. So... yes, sometimes you might say 'This guy is an idiot, this is way wrong!' with a high conviction, being right. Not to worry. Markets are made of expectations and the clash of conviction between its participants. Portfolio managers know that being an idiot is sometimes profitable and being smart is often a bad choice. It is all reality, sometimes good, sometimes bad. By the way: corrections to my analysis and intelligent debate is welcome. theintriguedtrader AT gmail do com

Thursday, May 12, 2011

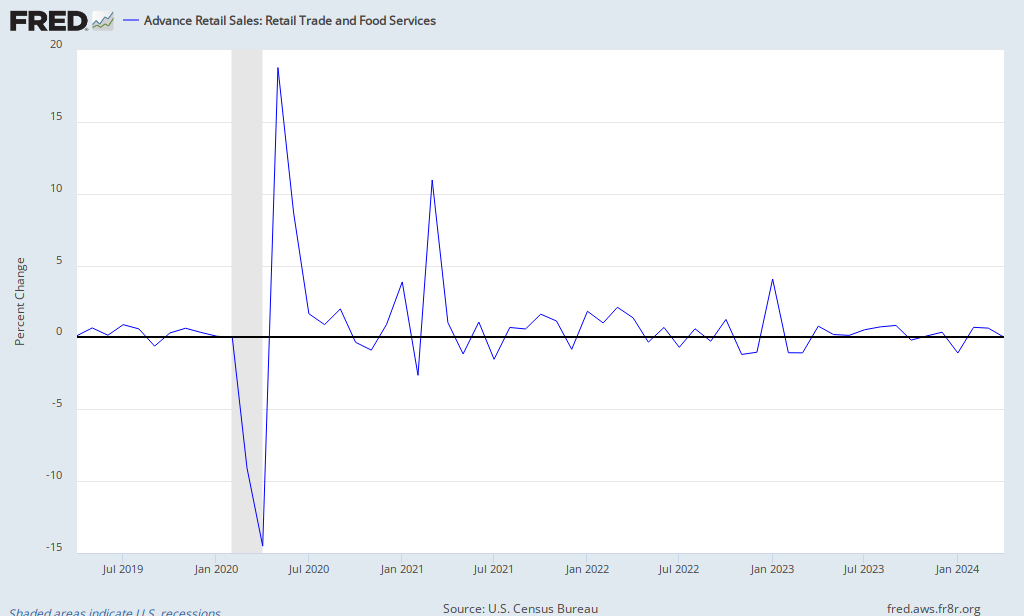
Retail and Food Services Sales - Lowest since July 2010

How robust is the recovery?


St. Louis Fed - Retail and Food Sales


Remember that back then, in July 2910, some were talking about a Double-Dip (Hi!) that was saved, IMHO, by:
a- The extension of the emergency and extended jobless benefits
b- Berna-man's speech hinting about QE2
c- Then it's confirmation
d- Then its start
e- Then by the fiscal stimulus package that was passed at the end of 2010 (payroll tax benefits, depreciation package for investment/capex)

a) Will last till the end of 2011, right?
b) Gone
c) Gone
d) It ends in 6 weeks
e) -- Payroll Tax Benefit: consumed by the increase in gasoline prices
----- Depreciation thingie: not sure. Need to learn more about it, but I'd say if the outlook doesn't improve too much people won't invest because of uncertainty even though it becomes 'cheaper'.

*Disclaimer: charts and data are presented as I receive/see them. Sources are usually not checked for validation and my own calculations are of 'back of the envelope'-type. I am aware that some math that I do myself might be wrong and/or misleading to some extent. In financial markets the rate of change of economic data is often more important than the actual level and the perception of 'what is priced in' is more important than 'what is actually going to happen'. This is actually the way people pick entry and exit points. So... yes, sometimes you might say 'This guy is an idiot, this is way wrong!' with a high conviction, being right. Not to worry. Markets are made of expectations and the clash of conviction between its participants. Portfolio managers know that being an idiot is sometimes profitable and being smart is often a bad choice. It is all reality, sometimes good, sometimes bad. By the way: corrections to my analysis and intelligent debate is welcome. theintriguedtrader AT gmail do com

Monday, May 9, 2011

So we get uber-expansionary Paul Krugman (supporter of a much larger QE1 back in 2009) talking about US inflation:

The Inflation Monster under the bed

I’m glad to see Greg Mankiw agreeing with me on the absence of any inflation risk in the current environment. Maybe he should have a word with everyone else in his party.

Here’s another way to think about the issue. As you can see above, wages have gone nowhere. Commodity prices, on the other hand, have gone up a lot lately (although they crashed last week).

So here are a couple of questions.
First, do you see any sign that workers are about to (or are even able to) demand higher wages to compensate for the higher prices of gas and food?
Second, do you any sign that employers are getting ready to make more generous wage offers?
Third, have you heard anything about companies feeling that they have room to raise prices by substantially more than the rise in their raw material costs?

The answer to all three questions is clearly no. So what we have is a rise in raw material prices, which will largely get passed on the consumers, but no hint that this is spreading into a wider rise in prices; and with labor costs flat, that means we get a one-time jump in consumer prices, but no persistent rise in inflation.

If you want to insist otherwise, you have to tell me how this is supposed to work. And I haven’t heard any coherent explanations to that effect.

And here is the market agreeing with Paul and average hourly wage growth.
US 1-year Treasury Bills now yielding powerful 0.16% per year.
That means that if you are a young man with a liquid networth of 1 million american lettuce-like dollars parked in US Bills, after one year, you can pay 1-month rent (1.6k USD * 1.62 BRL/USD = 2,592 BRL) for a one-bedroom (no garage spot) apartment in the classy neighborhood of Leblon in Rio de Janeiro/Brazil.


To wit:
This yield is lower than 0.26bps priced in markets in December 2008, right after Lehman went belly up.

Is the US Treasury market sending us signals?

Friday, May 6, 2011

Smoke signals?

So we got a new round of data today.

The almighty Non-Farm Payrolls were released today, survey for the April 12th week.
And the Household survey was also out.

NFP numbers were great: +244k gain
Household survey: -190k jobs.

David Rosembearish was on Bloomberg TV saying that Household survey is a better turning-point indicator. I'm not sure, but I like the guy, you know?

So the strong NFP didn't diverged from the huge increase in Initial Jobless Claims. When the NFP was surveyed IJC 4wk moving average was at 396k. Yesterday this metric was @ 431k. A sizable increase.

The markets reacted positively to the NFP news until rumors of Alpha-Beta-Gamma Debt-Mogul Greece leaving the Eurozone hit the market.
EURUSD crashed.
Deutsche Bank stocks got nailed... down 3.5%.. Puts volumes were 11-12x the regular volume or something like that.
E-Minis were around 1350.. then closed negative @ 1334ish.

The Commodities slump continued and the rally in bonds also (up to 10yr US Treasury).
Rogers Commodity Index: -1%
GSCI: -1.44%
WTI -2.6%

Even our friend Bill Gross came out of the woods to defend his 'I hate US Treasuries' call! I guess Jeff Gundlach from Double Line is going to have a great weekend! To wit, Jeff said Billy was wrong. He expected the US economy to slow down, therefore bringing with it these juicy UST yields. Spot. On.

BUT... a bit of that kind of data no ones talks about. Perhaps because it has no predictive power.
Association of American Railroads released the weekly Freight Carloads.

The 4-week moving average data SEAG looks as below. I am no expert at all, but I like to look at some different data... I'm not a big fan of boring sell-side reports and their opinions.


ECRI Leading Indicator, YoY:


ECRI Leading Indicator, 3m x 3m:


So... QE2 is ending and I believe the U.S. Activity will slow down considerably and the risk-markets will suffer... a lot.

From JP Morgan:

April saw growth of the global economy ease sharply for the second successive month to its weakest pace since the recovery began in August 2009. The weaker rate of expansion mainly reflected a significant cooling of business activity growth in the US non-manufacturing sector and further steep contractions in output at both Japanese manufacturers and service providers.

The JPMorgan Global All-Industry Output Index plunged to 51.8, well below February's near five-year peak of 59.1. Growth eased in both the global manufacturing and service sectors. The extent of the slowdown in services was especially marked, with the rate of expansion the lowest during the current 21-month period
of increase. Growth of manufacturing output fared better, but still slipped to its weakest pace since last September. 

All-industry output in the US rose at the slowest rate in seven months. Growth eased in China, the UK and Brazil, but picked up slightly in the Eurozone and India. The rate of contraction in Japan was the sharpest since March 2009.

2011 05 06 JPMorgan - Global Growth Slow Down