Friday, September 30, 2011

Hugh Hendry - Eclectica Fund Aug 2011 +1.5% MoM

So Mr. Hendry's latest report on his Eclectica Fund is out and not a lot of fundamentals, the part that I am mostly interested in,  were discussed. Just performance attribution, risk allocation, etc.

Hendry is now up 9.9% YTD.

Unfortunately I didn't find anything about his Credit fund which the FT said is over 30%+ this year betting against China.

Click for readable size.


*Disclaimer: charts and data are presented as I receive/see them. Sources are usually not checked for validation and my own calculations are of 'back of the envelope'-type. I am aware that some math that I do myself might be wrong and/or misleading to some extent. In financial markets the rate of change of economic data is often more important than the actual level and the perception of 'what is priced in' is more important than 'what is actually going to happen'. This is actually the way people pick entry and exit points. So... yes, sometimes you might say 'This guy is an idiot, this is way wrong!' with a high conviction, being right. Not to worry. Markets are made of expectations and the clash of conviction between its participants. Portfolio managers know that being an idiot is sometimes profitable and being smart is often a bad choice. It is all reality, sometimes good, sometimes bad. By the way: corrections to my analysis and intelligent debate is welcome. theintriguedtrader AT gmail do com

Monday, September 26, 2011

Am I Crazy to Short 6-month Italian CDS @ 400bp?

Today was an interesting day.

How so would ask the beautiful female readers (about 5 in the overall 5 females that follow the blog. Yes they're all beautiful)?

During brazilian market hours I was checking some interesting sorta-bull bets that could help decrease overall portfolio volatility, cover some of the downside I am currently exposed to and perhaps even earn some on-the-table risk premium.

I mean... we're here to make good risk-adjusted returns, so we want to make sure that volatility can be high if returns are also high and limiting probable maximum drawdowns.

So why was today an interesting day?

It is simple: I looked at 20-March-2012 Italian CDS spreads. WHAT? Aren't you the guy that believes Europe will blow up? Aren't you long German Dec16 CDS? And all the other bearish trades?

Yes. That's me.
The one who is long JPY March 2014 4% swaption payers because Japan has > 200% gross debt/GDP and > 100% Net Debt/GDP.

Yes, Italy also has > 100% Net-Debt / GDP.

And Italy, contrary to Japan, can't print its own currency.

So why in hell was I thinking about shorting Italian 6m CDS at around 400bps?

Let me be very straight forward here: 400bp for 170somethingdays is around 2% in carry.
That means that the 1.60% I spent for the May14 USDCNY Call would be paid for in case nothing happened to the world and it all looked again as beautiful as the female readers of the blog.

Then we can compare the 2% to the 1.30% or so I paid for the long JPY swaption payers. Also covered.

Then we can compare the 2% to the non-realized profits in the long German CDS bet. Or the long XAUXAG (gold x silver) bet.

I mean... This bet goes against what I have in my portfolio right now. Why would I want to do it? I mean. Italy has to roll some good EUR 200 billion in bonds until March 2012. That is SOME risk if you consider the recent auction results: poor bid-to-cover compared to previous auctions, rising yields overall, rising short-end yields (the curve has flattened remarkably) AND economic activity isn't doing well, Berlusconi is better at hitting on strippers than he is at coordinating a government.

So.... What makes me want to short 6m Italian CDS to collect this hefty risk premium?

Some interesting facts, consider I go short 100% of my NAV in this ugly baby:
(1) At 400bp/yr in carry, I get approx 1.1bp/day in carry. For a ~6m duration CDS.. that means the my break-even rate, at first, goes up by about 1.1/(360/180) = 2.2bps per day. As we get closer to expiration this bp/day increase in break-even rates goes up parabolically (1.1/time left to expiration). With 2 months left, 4 months passed accumulated carry will be 120 days * 1.1 = 132bp. And the break-even from entry would be 400+132/(2/12) = 400+ 132 * 12/2 = 1192 bp. If you look at what happened to Greece once its 6 month CDS hit 400bp.. it took some 8 months to reach 800bp. Well, different case. Italy can't really be bailed-out easily, but...
(2) Italy is the 3rd or 4th largest debt-load on the planet. And in this case this is good. Because if Italy goes belly-up and the recovery rate is, say, 20%.. I lose 80%. Ok. I am long 200% of 5y Germany. That means 200% * 5 = 10x the NAV. So if Germany spreads go up about 300bp, which sounds reasonable if Italy is on the verge of bankruptcy, I get some 30% back from the 80% I lose from Italian CDS. The USDCNY calls should perform nicely too. The EURBRL I do not know. The DI receivers I believe will perform well too. Long Gold / short Silver I think should perform well too.
(3) I believe that European policy makers would quickly find a solution for the Italian sovereign mess in these spreads sky-rocket. Laws and treaties and ECBs bond-purchase programs would be signed rather swiftly in this worst-case scenario. Italians would, by law, be forced into changing buon giorno to guten morgen in a matter of days. (spelling?)
(4) I don't think I can find a 4th reason, but that is why I didn't execute this trade today.

Thoughts?

My point here is that: we are starting to see interesting trades pop up.
There are more and more trades that we never thought attractive a few months ago that right now have started to look attractive. And I haven't been drinking, ladies.

I am not going to mention a bunch of "on this hand we have german politicians and on the other hand we have the french who are pro-unity, etc, etc" talk. I openly admit that I am no expert in politics, social contracts or how the italian deficit-reduction plan works. I openly admit that I do not read the fine lines of the EFSF proposal or the on-going SMP program. But I do spend some time trying to understand what goes on in the "only through unanimous decision can European solutions be moved forward". I understand that unanimous, when speaking about many different countries, encompassing different cultures, fiscal backgrounds, weekly-hours-worked, etc, mean "it will take longer than most believe and it will take further deterioration in most countries own situation" for anything to properly be voted, passed and acknowledged.

In the mean time, what am I afraid of? Lots of things.

Perhaps, tomorrow I will add some charts here to explain some of the risk-reward aspects of the trade.
I like these 6m CDSs shorts when they reach these more-than-1bp-per-day carry levels and right now some are laying around. Look at Argentina.


*Disclaimer: charts and data are presented as I receive/see them. Sources are usually not checked for validation and my own calculations are of 'back of the envelope'-type. I am aware that some math that I do myself might be wrong and/or misleading to some extent. In financial markets the rate of change of economic data is often more important than the actual level and the perception of 'what is priced in' is more important than 'what is actually going to happen'. This is actually the way people pick entry and exit points. So... yes, sometimes you might say 'This guy is an idiot, this is way wrong!' with a high conviction, being right. Not to worry. Markets are made of expectations and the clash of conviction between its participants. Portfolio managers know that being an idiot is sometimes profitable and being smart is often a bad choice. It is all reality, sometimes good, sometimes bad. By the way: corrections to my analysis and intelligent debate is welcome. theintriguedtrader AT gmail do com

Friday, September 23, 2011

The Tail Chaser: Performance Recap +31% since Feb11

Recently we have mentioned two new trades for The Tail Chaser's portfolio:
(A) Short EURBRL @ 2.3913 spot reference, 20% of NAV
(B) Receiving BRL DI Futures @ 10.89%, 300% of NAV

Drivers:
(A) There WAS a resistance around 2.40-spot and the USDBRL was exploding upwards. The carry is still very interesting, 54bp/month. Europe has a very serious debt problem, with periphery yields creeping higher even with the ECB pumping lots of cash into buying these issues. Banks will soon start to come to the surface with holes in their balance sheets while local politicians don't understand the severity of the big picture. AND I like some of the long-term BRL fundamentals like demographics, room for productivity growth, exposure to raw materials [especially food-related], room to cut interest rates to fuel economic growth and credit growth, etc.

BUT....
I have forgotten the reason I closed out the Short Ibovespa / Short USDBRL and the other Currency Basket trade: the IOF tax on new BRL longs through derivatives and the consensus 'We love Brazil' mood.

Opening Monday, following the trade executed last friday, the cross was already sky rocketing, and from there it only looked worse.
Looking at the stand-alone trade it was a case for getting out right away: BRL in a horrible momentum and the clear stop-price above the 2.40 resistance was broken EASILY. Like butter. But I stepped back and looked at the overall portfolio and decided to wait and see for a little longer.
In two days the Brazilian Central Bank called an FX auction and sold USD2bln+ into the market helping damp volatility and signalling to the market they were not just sitting, but watching and acting. And in the mean time the EUR started to drop a bit vs many currencies.

So... now I am more comfortable holding the position and, at 20% of the NAV, and me having an overall bearish portfolio, I am more comfortable with it.

(B) Receiving 300% of NAV in Jul12 BRL DI Futures: The Brazilian Central Bank has shown remarkable courage in reversing course in monetary policy on the last metting at the end of August even with current inflation very high. Allied with the Finance Ministry and the President, the BCB's speech has been very dovish. They sound like a hedge fund calling out market turmoil, heightened volatility and darker days ahead, a view that I share. That's very significant if coming from policy makers. After the equity markets tumbled this week, with commodities down considerably and currencies getting shattered against the USD and JPY I thought it was time to believe the BCB meant what he was saying. Using the panic in the local rates market, when pricing was of reduction in the overall size and length of rate cuts, probably because of people getting out of the local bond markets, I sold into the strength betting there's is a greater chance of larger cut in October, the world would collapse, inflation expectations in Brazil would decrease and the strong hand of the BCB on the USDBRL market would dampen volatility and improve its image with investors.

That's it.

Current positions:
~200% of NAV in Germany Dec16 CDS
~100% of NAV in May14 USDCNY 6.80 calls
~300% of NAV receiving Jul12 BRL DI Futures
~20%  of NAV short EURBRL
~100% of NAV long JPY Swaption Payers, strike 4%, March 2014
~15%  of NAV long Gold / short Silver (XAUXAG)


Some charts below...

*Disclaimer: charts and data are presented as I receive/see them. Sources are usually not checked for validation and my own calculations are of 'back of the envelope'-type. I am aware that some math that I do myself might be wrong and/or misleading to some extent. In financial markets the rate of change of economic data is often more important than the actual level and the perception of 'what is priced in' is more important than 'what is actually going to happen'. This is actually the way people pick entry and exit points. So... yes, sometimes you might say 'This guy is an idiot, this is way wrong!' with a high conviction, being right. Not to worry. Markets are made of expectations and the clash of conviction between its participants. Portfolio managers know that being an idiot is sometimes profitable and being smart is often a bad choice. It is all reality, sometimes good, sometimes bad. By the way: corrections to my analysis and intelligent debate is welcome. theintriguedtrader AT gmail do com

Wednesday, September 21, 2011

Paul Brodsky "The Twist Is All About The Banks Income Statements"


The Twist in essence reduces to a bank subsidy. How?

1)    Banks are taken out of levered long duration Treasury paper at cycle lows
2)    Banks increase their net holdings in the short end on a levered, positive carry basis (by repo-ing purchases of short paper with the Fed)

Is the Fed’s solvency at any lesser or greater risk? NO.

1)    Despite the duration extension of the Fed’s balance sheet, there is no incremental risk
2)    The Fed must now, however, be THE BID for the long end
3)    Real risk to bondholders, regardless of duration, is dollar devaluation (real risk), not rising interest rates (nominal risk)

So, in the near term, banks win, Fed breaks even, dollar and unlevered bondholders risk of devaluation is escalated.

Where from here?

1)    Incremental QE is no more or no less needed as a result of The Twist
2)    Incremental QE is ABSOLUTELY still necessary to shrink the unreserved debt to base money stock ratio
3)    Future QE may very likely require the Fed to bid out through the long end to defend yields across its holdings maturity spectrum

In sum, this is a move to help recapitalize banks under the guise of supporting the housing market and any wealth effect that might flow from that outcome. This is all about the banks income statements. Future and imminent QE will be about their balance sheets (dollar devaluation which then boosts nominal asset/collateral pricing).

Lee Quaintance & Paul Brodsky
QB Asset Management Company, LLC

*Disclaimer: charts and data are presented as I receive/see them. Sources are usually not checked for validation and my own calculations are of 'back of the envelope'-type. I am aware that some math that I do myself might be wrong and/or misleading to some extent. In financial markets the rate of change of economic data is often more important than the actual level and the perception of 'what is priced in' is more important than 'what is actually going to happen'. This is actually the way people pick entry and exit points. So... yes, sometimes you might say 'This guy is an idiot, this is way wrong!' with a high conviction, being right. Not to worry. Markets are made of expectations and the clash of conviction between its participants. Portfolio managers know that being an idiot is sometimes profitable and being smart is often a bad choice. It is all reality, sometimes good, sometimes bad. By the way: corrections to my analysis and intelligent debate is welcome. theintriguedtrader AT gmail do com

Friday, September 16, 2011

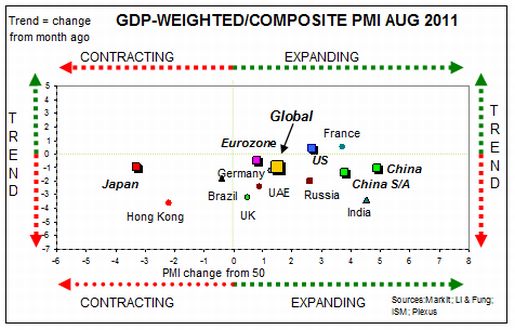
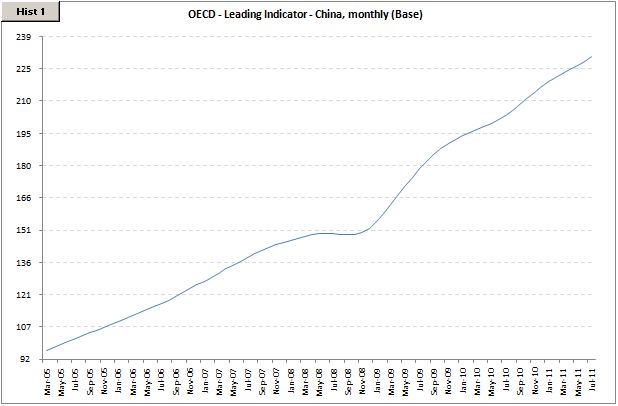
OECD Leading Indicators + Global PMI

Just some interesting charts.
New data was released by the OECD at the beginning of the week.
The PMI stuff was from Investment Postcards from Cape Town.

I guess economic data speaks more than opinions from experts (or myself).

I will come with more charts later today...


*Disclaimer: charts and data are presented as I receive/see them. Sources are usually not checked for validation and my own calculations are of 'back of the envelope'-type. I am aware that some math that I do myself might be wrong and/or misleading to some extent. In financial markets the rate of change of economic data is often more important than the actual level and the perception of 'what is priced in' is more important than 'what is actually going to happen'. This is actually the way people pick entry and exit points. So... yes, sometimes you might say 'This guy is an idiot, this is way wrong!' with a high conviction, being right. Not to worry. Markets are made of expectations and the clash of conviction between its participants. Portfolio managers know that being an idiot is sometimes profitable and being smart is often a bad choice. It is all reality, sometimes good, sometimes bad. By the way: corrections to my analysis and intelligent debate is welcome. theintriguedtrader AT gmail do com

Tuesday, September 13, 2011

NFIB Small Business Index is out this morning.
Considering that small businesses are the engine for job creation, while big corporations are able to increase productivity/automation, thus actually shedding jobs over the long run... things doesn't look too good. In fact, the 'Outlook for Business Conditions' made a new low, worse than 2008-2009 and 'Expectations for Higher Sales' dipped further to meet 2H08's levels. And that's without any large banks going world wide. I guess the small-biz managers also know something the overall rosy sell-side doesn't, right?

Below charts for the overall index (Optimism Index), Outlook for Business Conditions and Expectations of Higher Sales.

Then a chart with some other components that confuse me: if conditions for doing business are expected worse, if sales are expected to be also worse.. how can hiring plans be moving upward? I'm not the one to judge. I'm here to interpret.


*Disclaimer: charts and data are presented as I receive/see them. Sources are usually not checked for validation and my own calculations are of 'back of the envelope'-type. I am aware that some math that I do myself might be wrong and/or misleading to some extent. In financial markets the rate of change of economic data is often more important than the actual level and the perception of 'what is priced in' is more important than 'what is actually going to happen'. This is actually the way people pick entry and exit points. So... yes, sometimes you might say 'This guy is an idiot, this is way wrong!' with a high conviction, being right. Not to worry. Markets are made of expectations and the clash of conviction between its participants. Portfolio managers know that being an idiot is sometimes profitable and being smart is often a bad choice. It is all reality, sometimes good, sometimes bad. By the way: corrections to my analysis and intelligent debate is welcome. theintriguedtrader AT gmail do com

Sunday, September 11, 2011

Something bad is really happening

I am at home today so I can't pull many charts from Bloomberg to post alongside with what I am about to write, but I just want to point out a few facts.

Even though we can't affirm yet that we are in recession in some countries or that we soon will be, shockwaves are being sent our way in the form of market prices.

Does some one know stuff that isn't public yet?

John Mauldin, in his weekly letter, points out that the amount of deposits with the Fed from foreign institutions topped 2008-2009's highs.


Financial Institutions stocks have dropped dramatically since recent tops.
Some italian, french and spanish bank stocks have lost their 2009's lows.

The iTraxx European Senior Financials credit spreads have shot through last crisis' highs as I showed in the previous post.

Are market prices, again, causing the trouble?
Or are market prices simply making people see what they didn't want to see since stress subsided in mid 2009? That the amount of toxic debt around the world isn't sustainable?

Time to be nimble, simple and defensive.

The world is changing and so is the investing landscape. Central banks are out of monetary bullets and governments are out of fiscal bullets.

The bashing of bail-outs of equity holders and bond holders have been pretty strong and I really am not confident it will happen again in the same grand scale as it did in 2009.

Let's stay tuned for the next chapter of this on-going story. Very interesting times ahead.
Very interesting times.
*Disclaimer: charts and data are presented as I receive/see them. Sources are usually not checked for validation and my own calculations are of 'back of the envelope'-type. I am aware that some math that I do myself might be wrong and/or misleading to some extent. In financial markets the rate of change of economic data is often more important than the actual level and the perception of 'what is priced in' is more important than 'what is actually going to happen'. This is actually the way people pick entry and exit points. So... yes, sometimes you might say 'This guy is an idiot, this is way wrong!' with a high conviction, being right. Not to worry. Markets are made of expectations and the clash of conviction between its participants. Portfolio managers know that being an idiot is sometimes profitable and being smart is often a bad choice. It is all reality, sometimes good, sometimes bad. By the way: corrections to my analysis and intelligent debate is welcome. theintriguedtrader AT gmail do com