Wednesday, February 13, 2013

US Jobs Openings, Labor Turnover...

Just the December (lag...) JOLTS report.
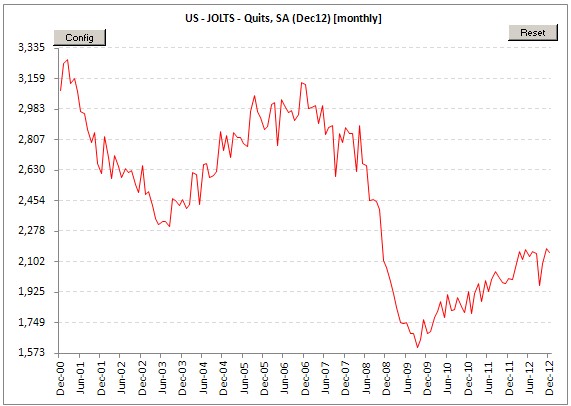
Like the JANUARY 2013 report, shows a slowing trend in [Hires - Separations], where Separations = Quits + Layoffs + People leaving workforce such as retired, invalid, etc.

The components, besides the reduction in Layoffs, don't look fantastic, with Openings, Hires and Quits (people less optimistic to leave their jobs and looking for a new one...) dropping in Dec12.


*Disclaimer: charts and data are presented as I receive/see them. Sources are usually not checked for validation and my own calculations are of 'back of the envelope'-type. I am aware that some math that I do myself might be wrong and/or misleading to some extent. In financial markets the rate of change of economic data is often more important than the actual level and the perception of 'what is priced in' is more important than 'what is actually going to happen'. This is actually the way people pick entry and exit points. So... yes, sometimes you might say 'This guy is an idiot, this is way wrong!' with a high conviction, being right. Not to worry. Markets are made of expectations and the clash of conviction between its participants. Portfolio managers know that being an idiot is sometimes profitable and being smart is often a bad choice. It is all reality, sometimes good, sometimes bad. By the way: corrections to my analysis and intelligent debate is welcome. theintriguedtrader AT gmail do com

Tuesday, February 12, 2013

And the G7 speaks up on FX volatility

And the Group of Seven comes trying to dampen volatility in FX markets. At least verbally.
That means the DAX won't have policy makers on their side.
Or the KOSPI, or the South Korean Won.

My 2-cents.

We, the G7 Ministers and Governors, reaffirm our longstanding commitment to market determined exchange rates and to consult closely in regard to actions in foreign exchange markets. We reaffirm that our fiscal and monetary policies have been and will remain oriented towards meeting our respective domestic objectives using domestic instruments, and that we will not target exchange rates. We are agreed that excessive volatility and disorderly movements in exchange rates can have adverse implications for economic and financial stability. We will continue to consult closely on exchange markets and cooperate as appropriate.

Philipp Hildebrand, the former Swiss central banker, also had his voice heard at the FT - No Such Thing as Global Currency War


And from yesterday...
*ECB'S WEIDMANN SAYS EURO ISN'T SERIOUSLY OVERVALUED *WEIDMANN WARNS POLICY MAKERS AGAINST TRYING TO WEAKEN THE EURO

And... more, from the US Treasury's undersecretary for international affairs Lael Brainard... said she supports Japan's attitude towards ending deflation, to "reinvigorate growth. It will be important that structural reforms accompany macroeconomic policites to achieve these goals".


*Disclaimer: charts and data are presented as I receive/see them. Sources are usually not checked for validation and my own calculations are of 'back of the envelope'-type. I am aware that some math that I do myself might be wrong and/or misleading to some extent. In financial markets the rate of change of economic data is often more important than the actual level and the perception of 'what is priced in' is more important than 'what is actually going to happen'. This is actually the way people pick entry and exit points. So... yes, sometimes you might say 'This guy is an idiot, this is way wrong!' with a high conviction, being right. Not to worry. Markets are made of expectations and the clash of conviction between its participants. Portfolio managers know that being an idiot is sometimes profitable and being smart is often a bad choice. It is all reality, sometimes good, sometimes bad. By the way: corrections to my analysis and intelligent debate is welcome. theintriguedtrader AT gmail do com

Monday, February 11, 2013

Back to South Korea... and the short in the KRW

A few weeks ago I talked about the KRW short here.

Back then I had to add a few charts about the country's External Accounts, etc.

So today I'll add them here for illustrative purposes. I don't take these as hard-science since I consider a lot of this subject as self-reinforcing trends x policy maneuvers, etc.
Competitiviness (starting point), macro stability (so external capital can sleep at night) and high returns on capital attract portfolio or direct investments, which propels growth, domestic income increases, internal consumption, etc, etc and then the herd effect takes care of keeping the currency going even if it is now expensive, players leveraged and returns too low (or bets crowded), etc.

All charts are 12-month rolling sums, not stock of capital for each account.

From the 1993-1995 period we had basically increasing sums of money pouring into South Korea through:
1) Increasing Portfolio Investment inflows
2) As the KRW becomes more expensive the Net-Exports position deteriorates and becomes negative YoY...

By end of 1995 the 12m rolling sum of these accounts becomes negative and the KRW stabilizes/tops with a deteriorating trend in Net-Exports being offset by herd behavior into Portfolio and Direct Invesments (that lasted a while longer).

Then we have the halt in Exports growth (which were strong in 1992-1994).. an acceleration in Net-Exports and when the crisis erupted in other East Asian nations... we know the story. The key-hole was too small for the elephant to squeeze himself out of the room and currency crisis set in, taking with it asset prices that needed to be converted into foreign currency to leave the country.

So here are the charts.


As the disclaimer mentions: This is just the framework I use to try to put pieces of the puzzle together. These are not necessarily causal relationships discovered through robust econometric models or anything of the likes. This is a simple way to look at flows in capital, leverage and liquidity and where policy is aimed at for the time being.

Right now I beliece policy makers are getting worried about the strength of the country's currency.
Exports are a much bigger chunk of the GDP, net-exports are the drivers of the positive current account while global growth is still lower than what it was during the last decade and alternatives for yields aren't so easily found.

They'll fight for a weaker currency too.


*Disclaimer: charts and data are presented as I receive/see them. Sources are usually not checked for validation and my own calculations are of 'back of the envelope'-type. I am aware that some math that I do myself might be wrong and/or misleading to some extent. In financial markets the rate of change of economic data is often more important than the actual level and the perception of 'what is priced in' is more important than 'what is actually going to happen'. This is actually the way people pick entry and exit points. So... yes, sometimes you might say 'This guy is an idiot, this is way wrong!' with a high conviction, being right. Not to worry. Markets are made of expectations and the clash of conviction between its participants. Portfolio managers know that being an idiot is sometimes profitable and being smart is often a bad choice. It is all reality, sometimes good, sometimes bad. By the way: corrections to my analysis and intelligent debate is welcome. theintriguedtrader AT gmail do com

Tuesday, February 5, 2013

Do 1yr variance-swaps shorts on USDJPY make sense @12.80% bid?

I think so.

I'll introduce 3 charts here.

1/ 30-day realized volatility on USDJPY fx-cross.
2/ A Histogram of 30d volatility since 1995 (including all the crisis)
3/ A chart on USDJPY 1y ATM volatility (it's the 3-day moving average, except for the last 10 data points)


Basically realized volatility has been in the 82nd percentile of historical observations in USDJPY 30-day since 1995.

Looking at the charts the take-ways are basically that it'd be tough days for volatility (or variance) sellers earlier in the Asian Crisis, then on the Russian Crisis and then a more normal sailing all the way up to the 2008 financial crisis when very high daily volatility was actually the norm for a few months.

I just checked and the BID is 12.80% for a short-vega position on 1year USDJPY variance swap, but I am suggesting readers should perhaps think about this trade and how it would behave within your portfolio.

The Japanese government and the Bank of Japan have been explicit that they want to kill deflation, and target mild inflation of around 2.0% in the country. Fine.

But in the mean time there are a few aspects we should keep in mind:
- Parabolic moves usually end in tears
- Policy Makers do not need that
- Japan's trade balance is in deficit, largely due to higher energy imports which have been more expensive due to JPY's devaluation
- Who is getting hurt by short-vega and short-gamma positions right now? Likely a/ banks [market makers in FX space] and b/ corporates [exporters] that are hedged, but need to place capital to cover mark-to-market / margin calls. Corporates, especially, could see a funding squeeze
- A lot of key levels have been broken like butter, implying short squeezes in price
- Implied volatility has skyrocketed also fast: people had to buy vega back to either reduce exposure or to realize a loss.
- Policy Makers have been vocal about the USDJPY level of 95.0. We're "there" already considering it was high-70s just a few months ago.
- Fears of destabilization in the JGB market should make policy makers worried about a sell-off in JGBs.

Where could this go wrong?
- More and more knock-outs / barriers all the way above current USDJPY levels or in other JPY crosses
- The situation really getting out of hand and policy makers losing control of things, meaning capital outflow of the country, possibly with very negative consequences for their bond market.

So... Food for thoughts.

PS: to spice things up perhaps it'd be good to use the possible carry of the trade to buy JPY Swaption payers.


Backtesting this strategy SINCE 1990 (shorting 1y USDJPY variance swaps) I got that the break-even level for expected return was, on WORST CASE situation, 11.49% for a positiong carried for the entire maturity of the swap.
So that is the Worst PnL x the Best. Since negative PnLs occurred less frequently, I think odds of this happening are smaller than thought.


Here are the summary of the backtests for 11.49% (break-even), 12% (level of ATMF 1y implied vol now) and 13% (current level in realized volatility).


*Disclaimer: charts and data are presented as I receive/see them. Sources are usually not checked for validation and my own calculations are of 'back of the envelope'-type. I am aware that some math that I do myself might be wrong and/or misleading to some extent. In financial markets the rate of change of economic data is often more important than the actual level and the perception of 'what is priced in' is more important than 'what is actually going to happen'. This is actually the way people pick entry and exit points. So... yes, sometimes you might say 'This guy is an idiot, this is way wrong!' with a high conviction, being right. Not to worry. Markets are made of expectations and the clash of conviction between its participants. Portfolio managers know that being an idiot is sometimes profitable and being smart is often a bad choice. It is all reality, sometimes good, sometimes bad. By the way: corrections to my analysis and intelligent debate is welcome. theintriguedtrader AT gmail do com

Thursday, January 24, 2013

1993-1995 analog? "Check". And now WHAT on the KRW?

On Jan 14 I posted on Twitter that KRW, MXN would be targets of the Japanese monetary sloppiness. It has started already.

So...

I'll change this/update this post later with more info as right now it is 11h30pm and I'm still at the office.

** I do not believe there'll be "1997 Asian Crisis" as many things are different structurally, but it seems to me there's a rationale for a gradual policy induced, activity pushed, devaluation of the Korean Won.

----------------------------------------------------------------------------------------

Is the South Korean Won a short?
Versus who?

I think so. USD anyone? Or other security/currency?

In mid 1990s many east asian currencies (remember the Asian Tigers?) were somehow pegged to the USD.

Good paper from 1999 with lots of details, interesting read.

Joseph Whitt [macro econ from the Atlanta Fed] - The Role of External Shocks in the Asian Financial Crisis

At the time policy changes pushed the USD higher versus the JPY and, while these smaller asian nations, with business models based on increasing exports and investments, were roaring. Investment and capital flows were inwards and in large amounts, their currencies went up in value versus others and versus the USD, which was stronger versus a strong tech-competitor, the Japanese Yen.

So where was SK then?

Exports as a percentage of GDP back then was like that and is now like this:


So if you do a little math, simple, to say, "When, outside of GDP drop (2008?), was the necessary change in Exports so low to make the yearly surplus go to 0% of GDP?". Find below. Of course that Imports could also drop, but with such a strong currency imports are likely to actually increase while exports decrease. That's a crush on Trade balance.

So... chart below: never! was the necessary change in Exports relative to Imports, due to their massive share of GDP (very open economy, huh?), so low for trade capital to get to 0.


So let's look at what happened back then with Exports... and what precipitaded the slow down, then reduction in capital flows:


And then what happened to the trade surplus... Back then the Surplus was actually a deficit, but with a rising KRW it got worse and worse.


So far the Trade Balance has been healthy and just some slow down in that as domestic activity has slowed down too curbing imports:


And that's why economic activity has slowed and there's little growth:


And inflation, helped by a stronger currency, has been so low...


Basically I expect rate cuts from the Bank of Korea due to basic things:
- reduced yields in local currency that will perhaps stop capital inflow into korean securities / bonds: less carry
- stimulate domestic activity through lower yields for corporates / investments

The BOK should soon start being more aggressive on currency interventions like so many other central banks have been: Fed, SNB, BOJ, Brazilian CB (Bacen), others, others..

In this case... a massive trigger for the BOK to act faster or with more intensity, either cutting rates or changing FX Swap position regulation for local banks or whatever is that South Korea has a export-mix which is very similar to Japan, whose currency has depreciated remarkably in the past few months: tech products, robots, TVs, vehicles. While importing raw materials, crude oil, foodstuffs.

Terms of Trade:


So... basically this is an objective start. Their current account has been explosive because 1/ Trade Balance continues very strong due to reduction in Imports and 2/ safe-haven flows into a country where rule of law applies, where productivity growth is good, where inflation is controlled and the financial system seems alright (or not?).

I need to elaborate on risk-reward, carry, etc, but I haven't had much time as I am focused in energy commodities right now. But this came to mind.

A few more charts. I'll update this post sometime this week with Current Account #s and whatnots.


*Disclaimer: charts and data are presented as I receive/see them. Sources are usually not checked for validation and my own calculations are of 'back of the envelope'-type. I am aware that some math that I do myself might be wrong and/or misleading to some extent. In financial markets the rate of change of economic data is often more important than the actual level and the perception of 'what is priced in' is more important than 'what is actually going to happen'. This is actually the way people pick entry and exit points. So... yes, sometimes you might say 'This guy is an idiot, this is way wrong!' with a high conviction, being right. Not to worry. Markets are made of expectations and the clash of conviction between its participants. Portfolio managers know that being an idiot is sometimes profitable and being smart is often a bad choice. It is all reality, sometimes good, sometimes bad. By the way: corrections to my analysis and intelligent debate is welcome. theintriguedtrader AT gmail do com

Friday, December 21, 2012

To a great Twenty-Thirteen


Twitter, which I've used more and more often, left me no choice.
I needed more room to write a longer post here at these silly blog pages.

So 2012 was a fantastic year. I didn't write much here (or anywhere).

But... 2012 was great fun!
I made some friends in the markets. Some sent me e-mails, some were met through Twitter or the DeMark (which I'm learning...) Chat on Bloomberg.


The world is changing in terms of how people interact and build communities, etc.

Quite interesting to see a variety of people, from different backgrounds, managing different amounts of money, from different sources, in different markets and all of them exchanging information, charts, research pieces. An older, more experienced guy I know asked me "Why do you do that? What do you gain? Why do you write on twitter or on the blog?".

The answer is rather simple for me.
It costs me very little. Time? Yes. Exposure which can be negative if I am proven wrong? Well. Shit happens. Managing money was never supposed to be easy.
And the feedback is fun and useful. And the personal reward of getting to know some interesting characters is tremendous. It's fun.

So...
For those who've made themselves present this year: let's rock and roll in 2013.
We live through very challenging times. I strongly believe it'll become even more challenging. Perhaps in 10 years! But helping each other out certainly pays. At least for the laughs!

Let me finish 2012 with wishes of health and fun for everybody. The rest is secondary.

So, to a kick-ass 2013.

Mute - Atrophied
http://www.youtube.com/watch?v=C0rjjVdSWks


*Disclaimer: charts and data are presented as I receive/see them. Sources are usually not checked for validation and my own calculations are of 'back of the envelope'-type. I am aware that some math that I do myself might be wrong and/or misleading to some extent. In financial markets the rate of change of economic data is often more important than the actual level and the perception of 'what is priced in' is more important than 'what is actually going to happen'. This is actually the way people pick entry and exit points. So... yes, sometimes you might say 'This guy is an idiot, this is way wrong!' with a high conviction, being right. Not to worry. Markets are made of expectations and the clash of conviction between its participants. Portfolio managers know that being an idiot is sometimes profitable and being smart is often a bad choice. It is all reality, sometimes good, sometimes bad. By the way: corrections to my analysis and intelligent debate is welcome. theintriguedtrader AT gmail do com

Sunday, November 4, 2012

How Hard Is It to Make Money?

Find below links to a few very interesting pieces.
They basically touch topics such as:

1) value-destruction in the money management industry,
2) our belief that we are better than what reality actually states (that, on average, we kinda suck),
3) people rely much more on trust than they rely on logical reasoning and facts.


Here is a link to a December 2011 letter by Absolute Return Partners' Niels Jensen on wealth destruction in our industry:
Niels Jensen - Absolute Return Partners - The Facts They Don't Want You To Know (Dec2011)

Here is a link to a FT Alphaville article about Niels' piece: 05 Dec 2012 - FT Alphaville - Spot The Dog let off the Leash

Daniel Kahneman - Mad Money on trust / logical reasoning x action

A Foolish Interview with Michael Mauboussin (chief investment strategist at Legg Mason Capital Management and adjunct professor of finance at the Columbia Business School) touching a mix of these topics.

Here is a screenshot of "Hedge Fund Market Wizards" (Jack Schwager). Chapter 10, interview with Martin Taylor, EM money manager.


So what am I doing in this cloudy Sunday afternoon? It certainly IS cloudy or I wouldn't be writing a blog entry on such a dangerous topic considering the beach is a few blocks away.

Why dangerous?
Because I am putting my neck on the line. A lot of money managers still think too highly of themselves, their methods and their image even if not having superb risk-adjusted returns. In my defense I am only stating facts. Not comparing myself to any manager or stating that I am any successful. I am just letting the lady reader know that I am aware of how hard it is to make money at all times and that the road to good risk-adjusted returns is deeply challenging.

I'd ask the reader to first check out all the pieces mentioned above before continuing reading. They state the facts and findings and I just want to add a little personal touch, in a blunt kind of way. And that is the dangerous point.


Again, bear with me if I sound confusing as I usually am. These topics touch sensible and interconnected matters.

Managing money is difficult. Beating benchmarks is difficult. Remaining alive for many years is difficult.

From Niels' piece:

"Using data from 1980 to 2008, the authors calculated the compound annual return for the average hedge fund to be 13.8%, easily outperforming more traditional asset classes over the period in question. This number makes hedge fund managers look like superstars when compared to traditional fund managers and is used by the hedge fund industry as one of the key reasons why everyone should invest in hedge funds.
Now to the naked reality. The best performance in the hedge fund industry came in the early years when assets under management were much smaller. The authors adjusted for this by calculating dollar-weighted returns instead; i.e. more recent returns when assets under management have been much bigger carry a higher weight than more distant returns when assets under management were negligible. The dollar-weighted number is thus a much better proxy for actual profits earned by investors in hedge funds. For the whole period 1980-2008 that number is 6.1% as opposed to the 13.8% headline number. Hardly blowing your socks off!"


I am writing about this because I strongly believe that the investment industry in Brazil is at a cross-roads.

Two major trends seem to have lost a lot of its power: the fall in nominal and real interest rates and the cheapness in relative (versus other countries) equity valuation. These 2 strong trends that had been ongoing since the late 90s/early 2000s after Lula was elected president and the volatility of inflation and its level has decreased were the fuel for another super trend which was the rise of the local currency, the BRL, versus the dollar

The multi-strategy and long-biased equity industry have had these 3 tail winds in the past 10 years and now I see them coming to a pause, especially considering the amount of securities available versus the amount of liquid funds searching for yield and the much lower nominal yields.

Brazilians aren't used to such low nominal interest rates and there will be a flood of capital into a rather young investment management industry. Managers have little experience in allocating capital into different markets. For example, during the period of 2010-2011 the multi-strategy (Multimercado) industry didn't show great performance. Coincidence or not the Ibovespa peaked in 3Q10, there was a change in leadership on the brazilian Central Bank, more government interventions in the FX market and there was a change in legislation that enabled funds to allocate some of their capital into off-shore vehicles which are used to place bets in foreign markets, such as in equity index, commodities, interest rate and currency futures. When did the local industry got back on its feet and performed very well? It might be a coincidence, but right when a new interest rate easing cycle begun in August 2011. In 2012 many funds have shown superb performances which, last I checked, had a 95%+ correlation with January 2014 DI (interest rate) futures. Should we dismiss these results because most of the funds seem to have been riding the bet on declining yields? Absolutely not. Absolutely no. A lot of merit goes into that. But I think this is certainly something that the local investor should keep an eye out for.

A few money managers in the country that had most of their performance derived from very concentrated bets had raised a LOT of capital recently and I think it will be very tough to deliver performance in the future unless they find different drivers than the ones from 2002 until recently.

Now comes the tough part which is really differentiating yourself from the crowd. The stage when you will have to look for opportunities in different niches. The stage when leverage on working-strategies of the past (leveraged beta) might not work. Just like it happened with the bull market in bonds and equities from 1982 in the US. In Brazil we had a commodities boom that worked in the past 10 years and macro stabilization (monetary and fiscal policy normalization, political goodwill increased considerably).

So.... how will the brazilian industry perform from here relative to the CDI (local benchmark, not an absolute return industry which is much fairer with the clients than the US absolute return industry) with a high concentration of assets under a few large managers (for the size of the local pool of securities) that grew very fast in the very recent past and with, I might be wrong on this, these 3 majors trends pausing?

Out of curiosity I would really like to see the performance breakdown of the top multi-strategy funds in the past 5 years. I think this should be the main question asset-allocators need addressed when deciding where to invest from now on.

...... to the next topic:

So, the whole idea for this entry originated today in a tweet from a colleague I met... through Twitter. I was looking for people who used DeMark technical indicators and some of my followers on twitter suggested his feed.
We exchanged a few messages about markets and when I went to NYC in September for a global macro conference we met for a chat over a few beers. Today he's online mentioning he trades off of technical indicators and that his employer wouldn't acknowledge that, meaning he pays for his chart-tools off of his own pocket, while using it to trade the company's money.

Where do I want to get? His tweet was just a cue into the pieces I mentioned above.

Money managers derive their returns from different investing or trading approaches. Some are well regarded. Others aren't.

Be them simple or not. You will get Fund Presentations with detailed descriptions of what their investment process consists of:
- what their macro backdrop is and how they got there
- how ideas are sourced and screened
- how market-timing is triggered- what their risk-management policy is
- how hedging is picked, if at all, etc

If equity long-biased Manager A picks the 5 bullet-points above and slap them on a nicely-done Powerpoint presentation I dare to say he has a better chance of raising funds or maintaining his client base after a few quarters or years of underperformance. Now if I tell you Manager A is married, has 2 kids, a PhD in physics from an Ivy League school and a beautifully architected office in a top-class neighborhood you should agree with me that the odds of fund raising or maintaining his client base after sub-par performance are even higher.

Martin Taylor points out the fact that Mark Mobius, a highly regarded "investment guru" in Emerging Markets for Franklin Templeton has underperformed the MSCI EM index for years but still manages billions of dollars in such strategy. How come? I'll leave it for Martin to opine: "The world of investment advisers is heavily influenced by media image so they suck their clients into this stuff.".

If I tell you that my Twitter friend trades off of DeMark technical indicators, spending 95% of his time analyzing charts, support lines and Sequential Countdown signals (then spends the remaining 5% of his time reading about actual fundamentals just for fun) I have a strong conviction that you would prefer Manager A. At least before letting you know what my friend's performance is relative to Mr. A's.

Does this make any sense? Empirical evidence from Kahneman and Niels' report cited above shows that this behavior is a reality.

Simple:

People care a lot more than they should about how their money managers look on paper (what they say their investment process is, what their resumes are, how wealthy they already are) than they care about their managers' returns against simple benchmarks.

People usually trust managers who appear to be very sophisticated. Managers who appear knowledgeable about macro economic matters, policy and companies' fundamentals will often have an advantage over a blunt guy who says he uses charts and strong risk management or 'law of large numbers" (ie: selling option premium systematically over time in a variety of a-priori uncorrelated markets which is simply the same as buying a diversified book of bonds. Same final pay-out structure: paid par, positive carry, risk of default) to derive his returns from.

We're here to make money. And, above all, we're here not to lose money.

Sorry for such a messy post. Got tired of writing midway (it's been 3 hours on it), but wanted to put something out despite its form.


*Disclaimer: charts and data are presented as I receive/see them. Sources are usually not checked for validation and my own calculations are of 'back of the envelope'-type. I am aware that some math that I do myself might be wrong and/or misleading to some extent. In financial markets the rate of change of economic data is often more important than the actual level and the perception of 'what is priced in' is more important than 'what is actually going to happen'. This is actually the way people pick entry and exit points. So... yes, sometimes you might say 'This guy is an idiot, this is way wrong!' with a high conviction, being right. Not to worry. Markets are made of expectations and the clash of conviction between its participants. Portfolio managers know that being an idiot is sometimes profitable and being smart is often a bad choice. It is all reality, sometimes good, sometimes bad. By the way: corrections to my analysis and intelligent debate is welcome. Email: theintriguedtrader AT gmail dot com